"1062d43bc714d570"{"id":"1001419","slug":"3d-dynamicdatacubechart-01","title":"3D DynamicDataCubeChart 01","category":"Gameplay Features","engine":"5.2+","assetVersion":"","engineVersion":"Engine Version: 5.2+","tag":"Gameplay Features","accent":"blue","visual":"mech","summary":"Configure 3D DynamicDataCubeChart 01 for real-time data visualization in virtual studios using Substrate shaders, Text3D, and dynamic cube arrays.","platform":"Unreal Engine","publishedAt":"2026-10-06T14:59:05.834Z","updatedAt":"2026-10-06T14:59:05.834Z","sourceNotes":[],"fileContents":[],"compatibility":["Unreal Engine","Engine Version: 5.2+"],"featuredImage":{"alt":"3D DynamicDataCubeChart 01","src":"/wp-content/uploads/published/2026/10/c0627c29c04e-fcf13a10-2b56-4f0d-9542-15991e2ba98b-5890c4ca73.webp"},"hasDownloadLink":true,"downloads":0,"terms":[{"taxonomy":"category","slug":"gameplay-features","name":"Gameplay Features"}],"galleryImages":[{"src":"/wp-content/uploads/published/2026/10/85e000a84137-16337f32-472a-42b7-a715-3d3606c649a6-b3cbfc6308.webp","alt":"3D DynamicDataCubeChart 01"},{"src":"/wp-content/uploads/published/2026/10/25b19a853857-aa6e4dc7-0808-4ed3-96f4-940982d4d4ca-1a0dc25233.webp","alt":"3D DynamicDataCubeChart 01"},{"src":"/wp-content/uploads/published/2026/10/5c482d11eaf5-c8b58fe1-5984-4710-9caf-6e0a5a57841c-b4af2e160e.webp","alt":"3D DynamicDataCubeChart 01"},{"src":"/wp-content/uploads/published/2026/10/e09322cbfe4e-556ce66b-7430-419a-b14b-2a89c157698f-3d8a86e156.webp","alt":"3D DynamicDataCubeChart 01"},{"src":"/wp-content/uploads/published/2026/10/dbab286f0b98-a3102e6a-d2ca-40eb-b65c-2176ab64b7dd-12df494963.webp","alt":"3D DynamicDataCubeChart 01"},{"src":"/wp-content/uploads/published/2026/10/45378ed6d3cd-9954e46b-14c4-4f27-99f4-ce1e87e21252-dd7dfe22c8.webp","alt":"3D DynamicDataCubeChart 01"},{"src":"/wp-content/uploads/published/2026/10/5b94f220ac96-86480fdb-d766-4b77-b992-763b4aeeee79-6d28038c02.webp","alt":"3D DynamicDataCubeChart 01"},{"src":"/wp-content/uploads/published/2026/10/b2ec48890779-6b31015f-70ea-41c8-8c76-7b3ca98952f4-acf39c3ac1.webp","alt":"3D DynamicDataCubeChart 01"},{"src":"/wp-content/uploads/published/2026/10/71ec13ddce10-a1811e20-6152-481c-b8db-7ade27b62e10-9bd9f170b9.webp","alt":"3D DynamicDataCubeChart 01"},{"src":"/wp-content/uploads/published/2026/10/927f414423ad-f5792e72-41d8-4822-b0db-d72d064ec81c-e3ec3318dd.webp","alt":"3D DynamicDataCubeChart 01"}],"accessPanel":{"kind":"resource","title":"Download this resource","eyebrow":"Free Download","message":"Log in or create a free account to start your download.","fileName":"Content.7z","safetyNote":"Resources are manually reviewed before listing to improve quality and reduce obvious risks.","actionLabel":"Download Free","resourceType":"Resource archive"},"contentHtml":"\u003ch2\u003eReal-Time Visual Staging in Virtual Studios\u003c/h2\u003e\u003cp\u003eModern real-time broadcasts and virtual studio environments require immediate graphic feedback that traditional pre-rendered elements cannot deliver. 3D DynamicDataCubeChart 01 resolves this operational challenge by supplying an out-of-the-box data visualization tool designed to display live figures on stage. The asset utilizes volumetric cube arrays to present metrics spatially, offering clear visual references for broadcast sets, corporate presentations, and interactive installations.\u003c/p\u003e\u003cp\u003eBecause the layout functions inside the engine in real time, visual assets do not need to be rebuilt or re-rendered whenever incoming metrics fluctuate. Instead, the cube arrays respond directly within the 3D scene, providing an immediate graphical readout that fits alongside other virtual production or visualization assets.\u003c/p\u003e\u003ch2\u003ePrerequisite Engine Setup for Text3D and Substrate Materials\u003c/h2\u003e\u003cp\u003eBefore introducing the asset into a project pipeline, specific engine features must be activated to ensure stability and proper visual rendering. The typography in this asset relies on the engine's built-in Text3D plug-in. If this plug-in is inactive when the files are accessed, the engine will report errors and prevent the asset from working normally. The proper implementation sequence is to enable the Text3D plug-in inside the project settings first, restart if prompted, and only then import the asset files.\u003c/p\u003e\u003cp\u003eMaterial rendering also requires explicit configuration within the project settings. The asset is constructed around the Substrate material pipeline and requires three specific options enabled:\u003c/p\u003e\u003cul\u003e\u003cli\u003eSubstrate Materials\u003c/li\u003e\u003cli\u003eSubstrate opaque material rough refraction\u003c/li\u003e\u003cli\u003eSubstrate advanced visualization shaders\u003c/li\u003e\u003c/ul\u003e\u003cp\u003eFailing to turn on these Substrate parameters renders the asset materials useless, resulting in missing shader logic and broken visual surfaces. Verifying these Substrate material settings alongside the Text3D plug-in guarantees that the chart materials compile correctly upon loading.\u003c/p\u003e\u003ch2\u003ePercentage and Voting Modes in 3D Dynamic Data Cube Chart\u003c/h2\u003e\u003cp\u003eThe asset organizes numerical information into two primary presentation modes: percentage mode and voting mode. Each mode adapts the cube layout to match distinct communication workflows inside data visualization projects.\u003c/p\u003e\u003cp\u003ePercentage mode formats data into proportional divisions, making it suitable for progress metrics, distribution ratios, and completion tallies. In this configuration, the cube structure scales to reflect parts of a whole, offering an intuitive gauge for general statistical readouts. Voting mode reconfigures the presentation for competitive or polling contexts. It provides a visual structure suited for elections, audience polling, survey tallies, and comparative decisions, where individual metrics must stand distinct from one another for quick visual evaluation during live broadcasts.\u003c/p\u003e\u003ch2\u003eVisual Customization Across Data Cubes, Colors, and Text\u003c/h2\u003e\u003cp\u003eTo integrate smoothly with existing project branding and scene aesthetics, 3D DynamicDataCubeChart 01 provides a broad range of user-definable visual parameters. The system allows direct control over the number of Data Cubes active in any given chart, enabling creators to scale the complexity of the grid to match the volume of information being presented.\u003c/p\u003e\u003cp\u003eColor customization options permit operators to align the data blocks with specific corporate branding palettes or studio lighting setups. Beyond solid shading, the tool supports the integration of pictures across the setup, allowing custom iconography or imagery to sit beside or on the chart structure. The accompanying Text3D fields can be customized to display descriptive labels, titles, and exact numerical readouts, ensuring the visual cubes are properly paired with readable typography.\u003c/p\u003e\u003ch2\u003eAnimation Sequences and One-Click Real-Time Updates\u003c/h2\u003e\u003cp\u003eData presentation inside live environments relies heavily on polished camera transitions and on-air motion. The asset includes built-in animation sequences for appearance and hiding, allowing charts to enter and exit scenes cleanly without abrupt visibility toggles. Smooth transition animations are also implemented for state changes, giving the cube elements fluid motion as metrics shift from one value to another.\u003c/p\u003e\u003cp\u003eWhen numerical adjustments occur during a session, the asset supports real-time data modification with a one-click update process. Operators can modify numerical inputs on the fly and trigger the chart to recalculate its visual layout instantly, removing the friction of manual readjustment during live operations.\u003c/p\u003e\u003ch2\u003ePipeline Integration via Data Interface Functions\u003c/h2\u003e\u003cp\u003eConnecting data graphics to external control pipelines requires dependable communication paths. 3D DynamicDataCubeChart 01 includes data interface functions created specifically to facilitate data transfer through alternative methods. These interface hooks allow Blueprint scripts and external data inputs to push values into the chart logic systematically, ensuring the chart acts as a receptive visual endpoint rather than an isolated static asset.\u003c/p\u003e\u003cp\u003eFor projects balancing live data feeds with real-time studio cameras, ensuring that both the Text3D plug-in and the full Substrate shader pipeline are configured beforehand allows the asset's percentage and voting systems to run reliably right out of the box.\u003c/p\u003e\n\n\u003ch2\u003eExplore Similar Assets\u003c/h2\u003e\n\u003cul\u003e\n\u003cli\u003e\u003ca href=\"https://3dcghub.com/data-array-visualizers/\" title=\"Data Array Visualizers\"\u003eData Array Visualizers\u003c/a\u003e\u003c/li\u003e\n\u003cli\u003e\u003ca href=\"https://3dcghub.com/next-gen-destruction-toolkit/\" title=\"Next Gen Destruction Toolkit\"\u003eNext Gen Destruction Toolkit\u003c/a\u003e\u003c/li\u003e\n\u003cli\u003e\u003ca href=\"https://3dcghub.com/balloons/\" title=\"Balloons\"\u003eBalloons\u003c/a\u003e\u003c/li\u003e\n\u003cli\u003e\u003ca href=\"https://3dcghub.com/ultimate-spell-system/\" title=\"Ultimate Spell System\"\u003eUltimate Spell System\u003c/a\u003e\u003c/li\u003e\n\u003cli\u003e\u003ca href=\"https://3dcghub.com/physics-collision-sound/\" title=\"Physics Collision Sound\"\u003ePhysics Collision Sound\u003c/a\u003e\u003c/li\u003e\n\u003c/ul\u003e","contentTextLength":5481,"navigation":{"current":25,"total":3379,"previous":{"id":"1001420","slug":"4-in-1-modular-research-facility-mega-bundle-2025","title":"4 IN 1 Modular Research Facility / Mega Bundle 2025","category":"Sci-Fi","platform":"Unreal Engine","updatedAt":"2026-10-06T14:59:43.264Z"},"next":{"id":"1001418","slug":"100-explosion-pack-niagara","title":"100 Explosion Pack Niagara","category":"Fire \u0026 Explosions","platform":"Unreal Engine","updatedAt":"2026-10-06T14:54:36.669Z"}},"relatedResources":[{"id":"10708","slug":"data-array-visualizers","title":"Data Array Visualizers","category":"Gameplay Features","engine":"5.1+","assetVersion":"Engine version: 5.1+","engineVersion":"5.0","tag":"Gameplay Features","accent":"blue","visual":"city","summary":"Enhance your project's visual quality with 12 high-quality Niagara VFX designed to visualize data arrays in real-time. This game-ready pack is easy to customize and requires no advanced blueprinting knowledge.","platform":"Unreal Engine","publishedAt":"2026-03-03T16:01:56.000Z","updatedAt":"2026-04-19T15:49:57.000Z","sourceNotes":[],"fileContents":[],"compatibility":["Unreal Engine","Engine version: 5.1+"],"featuredImage":{"alt":"Data Array Visualizers","src":"https://3dcghub.com/wp-content/uploads/2026/03/eab0b72c-cf2f-4a85-bee0-0981c6073e80.webp"},"hasDownloadLink":true,"downloads":0},{"id":"1001004","slug":"next-gen-destruction-toolkit","title":"Next Gen Destruction Toolkit","category":"Gameplay Features","engine":"5.3+","assetVersion":"","engineVersion":"Engine Version: 5.3+","tag":"Gameplay Features","accent":"blue","visual":"mech","summary":"A UE5 Chaos Destruction framework using data assets, surface-driven VFX and sound, with 15 Blueprints and 14 Niagara systems. Built for Nanite/Lumen.","platform":"Unreal Engine","publishedAt":"2026-08-22T10:54:47.045Z","updatedAt":"2026-08-22T10:54:47.045Z","sourceNotes":[],"fileContents":[],"compatibility":["Unreal Engine","Engine Version: 5.3+"],"featuredImage":{"alt":"Next Gen Destruction Toolkit","src":"/wp-content/uploads/published/2026/08/ae98b282cc03-ed3bc7a2-1533-4764-9cea-bf9d64a790d8-8eb923473f.webp"},"hasDownloadLink":true,"downloads":5},{"id":"28521","slug":"balloons","title":"Balloons","category":"Gameplay Features","engine":"5.2+","assetVersion":"Engine version: 5.2+","engineVersion":"","tag":"Gameplay Features","accent":"blue","visual":"character","summary":"Balloons focuses on scene-ready balloon behavior rather than a single static prop. It includes blueprints for precise placement, anchor-tied bunches, and large loose balloon spawns, with control over speed, helium, materials, meshes, strings, and spawn amount.","platform":"Unreal Engine","publishedAt":"2026-05-16T07:52:05.000Z","updatedAt":"2026-05-16T07:52:06.000Z","sourceNotes":[],"fileContents":[],"compatibility":["Unreal Engine","Engine version: 5.2+"],"featuredImage":{"alt":"Balloons","src":"https://3dcghub.com/wp-content/uploads/2026/05/89ab9d49611e_158efac7-d2f5-4a55-b264-f4c0f813133d.webp"},"hasDownloadLink":true,"downloads":0}]}
Gameplay Features
3D DynamicDataCubeChart 01
Configure 3D DynamicDataCubeChart 01 for real-time data visualization in virtual studios using Substrate shaders, Text3D, and dynamic cube arrays.
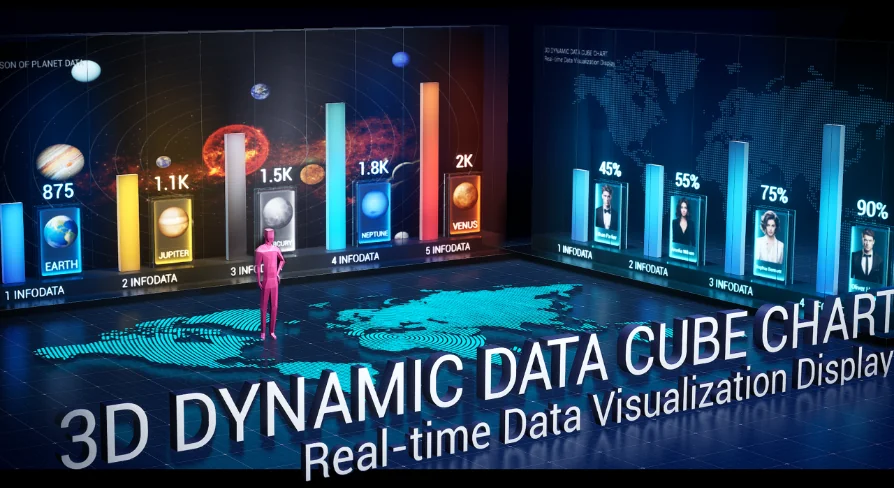
Modern real-time broadcasts and virtual studio environments require immediate graphic feedback that traditional pre-rendered elements cannot deliver. 3D DynamicDataCubeChart 01 resolves this operational challenge by supplying an out-of-the-box data visualization tool designed to display live figures on stage. The asset utilizes volumetric cube arrays to present metrics spatially, offering clear visual references for broadcast sets, corporate presentations, and interactive installations.
Because the layout functions inside the engine in real time, visual assets do not need to be rebuilt or re-rendered whenever incoming metrics fluctuate. Instead, the cube arrays respond directly within the 3D scene, providing an immediate graphical readout that fits alongside other virtual production or visualization assets.
Prerequisite Engine Setup for Text3D and Substrate Materials
Before introducing the asset into a project pipeline, specific engine features must be activated to ensure stability and proper visual rendering. The typography in this asset relies on the engine's built-in Text3D plug-in. If this plug-in is inactive when the files are accessed, the engine will report errors and prevent the asset from working normally. The proper implementation sequence is to enable the Text3D plug-in inside the project settings first, restart if prompted, and only then import the asset files.
Material rendering also requires explicit configuration within the project settings. The asset is constructed around the Substrate material pipeline and requires three specific options enabled:
Substrate Materials
Substrate opaque material rough refraction
Substrate advanced visualization shaders
Failing to turn on these Substrate parameters renders the asset materials useless, resulting in missing shader logic and broken visual surfaces. Verifying these Substrate material settings alongside the Text3D plug-in guarantees that the chart materials compile correctly upon loading.
Percentage and Voting Modes in 3D Dynamic Data Cube Chart
The asset organizes numerical information into two primary presentation modes: percentage mode and voting mode. Each mode adapts the cube layout to match distinct communication workflows inside data visualization projects.
Percentage mode formats data into proportional divisions, making it suitable for progress metrics, distribution ratios, and completion tallies. In this configuration, the cube structure scales to reflect parts of a whole, offering an intuitive gauge for general statistical readouts. Voting mode reconfigures the presentation for competitive or polling contexts. It provides a visual structure suited for elections, audience polling, survey tallies, and comparative decisions, where individual metrics must stand distinct from one another for quick visual evaluation during live broadcasts.
Visual Customization Across Data Cubes, Colors, and Text
To integrate smoothly with existing project branding and scene aesthetics, 3D DynamicDataCubeChart 01 provides a broad range of user-definable visual parameters. The system allows direct control over the number of Data Cubes active in any given chart, enabling creators to scale the complexity of the grid to match the volume of information being presented.
Color customization options permit operators to align the data blocks with specific corporate branding palettes or studio lighting setups. Beyond solid shading, the tool supports the integration of pictures across the setup, allowing custom iconography or imagery to sit beside or on the chart structure. The accompanying Text3D fields can be customized to display descriptive labels, titles, and exact numerical readouts, ensuring the visual cubes are properly paired with readable typography.
Animation Sequences and One-Click Real-Time Updates
Data presentation inside live environments relies heavily on polished camera transitions and on-air motion. The asset includes built-in animation sequences for appearance and hiding, allowing charts to enter and exit scenes cleanly without abrupt visibility toggles. Smooth transition animations are also implemented for state changes, giving the cube elements fluid motion as metrics shift from one value to another.
When numerical adjustments occur during a session, the asset supports real-time data modification with a one-click update process. Operators can modify numerical inputs on the fly and trigger the chart to recalculate its visual layout instantly, removing the friction of manual readjustment during live operations.
Pipeline Integration via Data Interface Functions
Connecting data graphics to external control pipelines requires dependable communication paths. 3D DynamicDataCubeChart 01 includes data interface functions created specifically to facilitate data transfer through alternative methods. These interface hooks allow Blueprint scripts and external data inputs to push values into the chart logic systematically, ensuring the chart acts as a receptive visual endpoint rather than an isolated static asset.
For projects balancing live data feeds with real-time studio cameras, ensuring that both the Text3D plug-in and the full Substrate shader pipeline are configured beforehand allows the asset's percentage and voting systems to run reliably right out of the box.
 Gameplay Features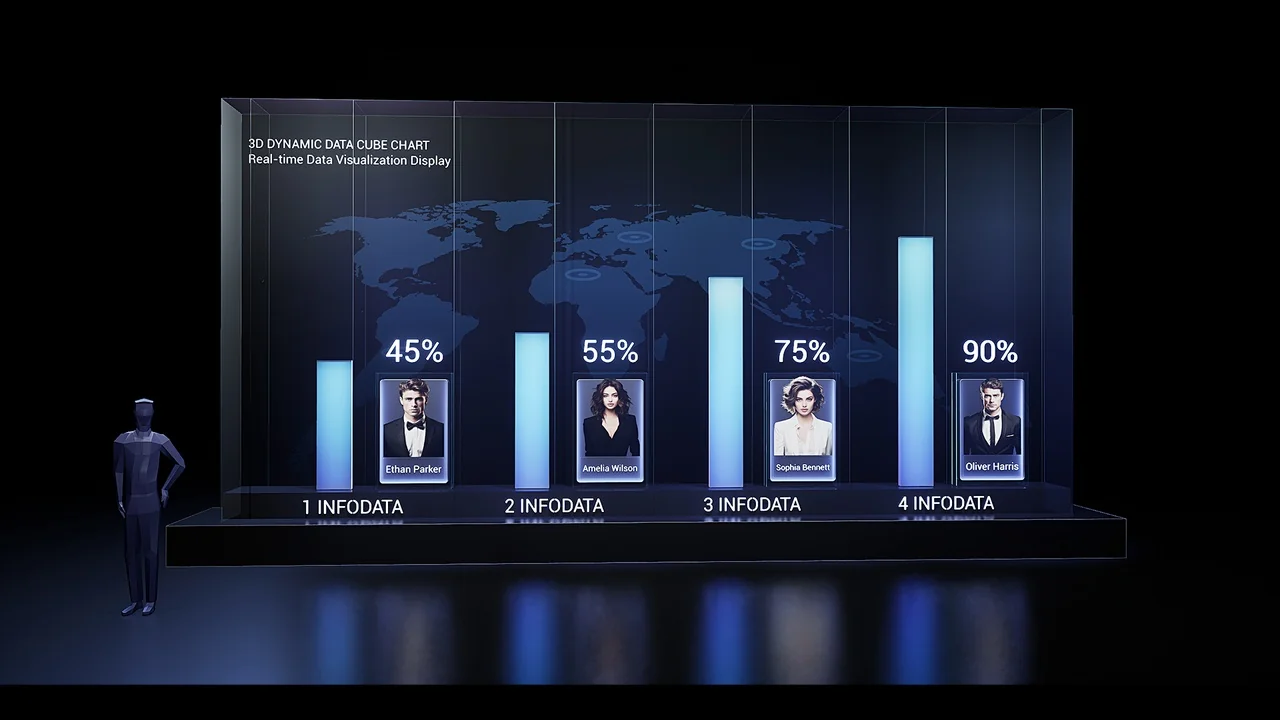
 Gameplay Features
 Gameplay Features
 Gameplay Features