"6ac84fdb0bd06614"{"id":"1000895","slug":"thermodynamic-chart","title":"Thermodynamic Chart","category":"Engine Tools","engine":"5.7","assetVersion":"Asset Version: 1.0","engineVersion":"Engine Version: 5.7","tag":"Engine Tools","accent":"blue","visual":"mech","summary":"Generate heat maps directly from data points in Unreal Engine. Set max/min intervals, add points, and color intensity grows with density. Supports high-precisio","platform":"Unreal Engine","publishedAt":"2026-08-06T04:45:48.733Z","updatedAt":"2026-08-06T04:45:48.733Z","sourceNotes":[],"fileContents":[],"compatibility":["Unreal Engine","Asset Version: 1.0","Engine Version: 5.7"],"featuredImage":{"alt":"Thermodynamic Chart","src":"/wp-content/uploads/published/2026/08/79cf7f7fe940-242955e9-624e-4df9-acd6-972a2dd49893-2644df0ed3.webp"},"hasDownloadLink":true,"downloads":0,"terms":[{"taxonomy":"category","slug":"engine-tools-tools-and-plugins","name":"Engine Tools"}],"galleryImages":[{"src":"/wp-content/uploads/published/2026/08/57159024009b-40494b8d-48da-46f6-a0a0-b07cef7cd1bc-d73e6562b0.webp","alt":"Thermodynamic Chart"},{"src":"/wp-content/uploads/published/2026/08/1585881ded28-c2d90f1b-c3c3-424d-a653-134c7e619b63-825fb20560.webp","alt":"Thermodynamic Chart"}],"accessPanel":{"kind":"resource","title":"Download this resource","eyebrow":"Free Download","message":"Log in or create a free account to start your download.","fileName":"5.7.7z","safetyNote":"Resources are manually reviewed before listing to improve quality and reduce obvious risks.","actionLabel":"Download Free","resourceType":"Resource archive"},"contentHtml":"\u003cp\u003eWhen a project needs to show how frequently events happen across a surface, raw data points alone are hard to read. A thermodynamic chart solves that by translating those points into a color gradient. In Unreal Engine, the \u003cem\u003eThermodynamic Chart\u003c/em\u003e plugin does exactly that: you define the value range, place your data, and the Map builds itself based on where points cluster.\u003c/p\u003e\n\n\u003ch2\u003eData Points and Color Intensity\u003c/h2\u003e\n\n\u003cp\u003eThe core mechanic is straightforward. You provide a maximum and minimum interval, then start adding data points into the middle of that range. The chart reads the density of points at any given location. The more points accumulate in 1 spot, the more obvious the color change becomes. That means a sparse area stays cool or muted, while a dense area pushes toward the hot end of the spectrum.\u003c/p\u003e\n\n\u003cp\u003eThis interval-based setup makes the tool flexible. Instead of hard-coding color values for every coordinate, you work with a data-driven system. Adjust the interval, add or remove points, and the heat map updates accordingly. The workflow is simple and easy to use, which is 1 of the strengths mentioned for the plugin.\u003c/p\u003e\n\n\u003ch2\u003eHigh-Precision Data and the Latitude/Longitude Use Case\u003c/h2\u003e\n\n\u003cp\u003e1 detail that stands out is support for high-precision data, with latitude and longitude called out as an example. This matters for any production that deals with real-world geographic coordinates. Latitude and longitude values carry far more decimal precision than typical scene coordinates, and the chart can handle them without losing fidelity.\u003c/p\u003e\n\n\u003cp\u003eFor teams working on Geographic Information System (GIS)-style visualizations, telemetry overlays, or location-based analytics, this opens a practical path. You can feed in coordinate pairs and see population density, incident frequency, or any other location-bound metric rendered as a heat map directly inside Unreal Engine. The high-precision support means you don't have to round or simplify the data before using it.\u003c/p\u003e\n\n\u003ch2\u003eFinding the Asset in Unreal Engine's Content Browser\u003c/h2\u003e\n\n\u003cp\u003eGetting started involves a quick \u003ccode\u003eContent Browser\u003c/code\u003e setup. In the upper-right corner of the \u003ccode\u003eContent Browser\u003c/code\u003e, click the \u003ccode\u003eSettings\u003c/code\u003e button. That opens a menu with options for the current instance. Under the \u003ccode\u003eView\u003c/code\u003e category, check the \u003ccode\u003eShow Plugin Content\u003c/code\u003e option. Once that's enabled, you can navigate to the \u003ccode\u003eThermodynamic Chart \u003e Content \u003e Thermodynamic Chart\u003c/code\u003e directory.\u003c/p\u003e\n\n\u003cp\u003eThat directory contains sample Levels and related assets. The samples give you a reference for how the chart behaves, how the data points are placed, and how the color output looks in a real scene. Having sample Levels included is a practical advantage because it shortens the learning curve. You can open a Level, inspect the setup, and adapt it to your own data.\u003c/p\u003e\n\n\u003ch2\u003eGround Fitting Update and Engine Version Support\u003c/h2\u003e\n\n\u003cp\u003eThe change log shows a May 2021 update that adds the option to fit to the ground. That feature is listed as pending approval, but it points directly to a common production need: heat maps that conform to Terrain instead of floating in space. When a chart can snap to the ground, it becomes much easier to integrate into exterior scenes, landscape-based visualizations, or urbanscape projects.\u003c/p\u003e\n\n\u003cp\u003eEarlier, in February 2021, version support was added for Unreal Engine 4.25 (UE4.25). This version compatibility is important for teams working on projects that have not yet migrated to newer engine releases. It means the \u003cem\u003eThermodynamic Chart\u003c/em\u003e can be used in a UE4.25-based pipeline without forcing an upgrade.\u003c/p\u003e\n\n\u003ch2\u003eWho Gets the Most Value\u003c/h2\u003e\n\n\u003cp\u003eThe \u003cem\u003eThermodynamic Chart\u003c/em\u003e is aimed at anyone who needs to turn numerical data into visual insight inside Unreal Engine. Level Designers can use it to show danger zones or resource hotspots. Data visualization teams can map real-world statistics onto a surface. Researchers and urban planners working with latitude and longitude data will find the high-precision support particularly useful.\u003c/p\u003e\n\n\u003cp\u003eBecause the core workflow is just setting an interval and adding points, it fits into rapid iteration. You can experiment with different data densities, adjust the range, and see the color response immediately. The included sample Levels reduce setup friction, and the ground-fitting option, once available, will make Terrain-based deployments even more straightforward.\u003c/p\u003e\n\n\u003cp\u003eFor a production that needs a reliable, data-driven heat map without building the rendering logic from scratch, the \u003cem\u003eThermodynamic Chart\u003c/em\u003e offers a focused solution. It handles the mapping from data density to color, supports high-precision inputs, and slots directly into Unreal Engine's \u003ccode\u003eContent Browser\u003c/code\u003e workflow.\u003c/p\u003e\n\n\u003ch2\u003eMore From The Same Workflow\u003c/h2\u003e\n\u003cul\u003e\n\u003cli\u003e\u003ca href=\"https://3dcghub.com/radar-chart-widget/\" title=\"Radar Chart Widget\"\u003eRadar Chart Widget\u003c/a\u003e\u003c/li\u003e\n\u003cli\u003e\u003ca href=\"https://3dcghub.com/simplecharts/\" title=\"SimpleCharts\"\u003eSimpleCharts\u003c/a\u003e\u003c/li\u003e\n\u003cli\u003e\u003ca href=\"https://3dcghub.com/shader-compilation-screen-remove-shader-stutters/\" title=\"Shader Compilation Screen - remove shader stutters\"\u003eShader Compilation Screen - remove shader stutters\u003c/a\u003e\u003c/li\u003e\n\u003cli\u003e\u003ca href=\"https://3dcghub.com/blueprint-mesh-extractor/\" title=\"Blueprint Mesh Extractor\"\u003eBlueprint Mesh Extractor\u003c/a\u003e\u003c/li\u003e\n\u003cli\u003e\u003ca href=\"https://3dcghub.com/object-distribution-tool-objectt-distributed-tooll-objecting-distributing/\" title=\"Object Distribution Tool (Objectt Distributed Tooll Objecting Distributing)\"\u003eObject Distribution Tool (Objectt Distributed Tooll Objecting Distributing)\u003c/a\u003e\u003c/li\u003e\n\u003c/ul\u003e","contentTextLength":4780,"navigation":{"current":367,"total":3181,"previous":{"id":"1000896","slug":"third-person-story-adventure-template","title":"Third Person Story Adventure Template","category":"Gameplay Features","platform":"Unreal Engine","updatedAt":"2026-08-06T04:48:47.283Z"},"next":{"id":"1000894","slug":"stylized-volumetric-clouds-shader","title":"Stylized Volumetric Clouds Shader","category":"Shaders","platform":"Unreal Engine","updatedAt":"2026-08-06T04:43:20.840Z"}},"relatedResources":[{"id":"14415","slug":"radar-chart-widget","title":"Radar Chart Widget","category":"Engine Tools","engine":"4.26 - 5.4","assetVersion":"Engine version: 4.26 - 5.4","engineVersion":"4.24","tag":"Engine Tools","accent":"blue","visual":"animation","summary":"Enhance your game's user interface with the Radar Chart Widget, a tool designed for clear data comparison. This interactive asset supports mouse input and fits various genres from RPGs to simulations.","platform":"Unreal Engine","publishedAt":"2026-03-11T18:00:22.000Z","updatedAt":"2026-04-19T15:45:46.000Z","sourceNotes":[],"fileContents":[],"compatibility":["Unreal Engine","Engine version: 4.26 - 5.4"],"featuredImage":{"alt":"Radar Chart Widget","src":"https://3dcghub.com/wp-content/uploads/2026/03/eb10402c-0b17-4798-8362-faacfeac8e7e.webp"},"hasDownloadLink":true,"downloads":0},{"id":"15359","slug":"simplecharts","title":"SimpleCharts","category":"Procedural Systems","engine":"4.25 - 4.27,5.0 - 5.3","assetVersion":"Engine version: 4.25 - 4.27,5.0 - 5.3","engineVersion":"5.1","tag":"Procedural Systems","accent":"blue","visual":"character","summary":"SimpleCharts provides a streamlined solution for developers needing to integrate dynamic charts into their projects using UMG or Blueprints. This plugin leverages Echarts for high-quality visualization and supports multiple platforms.","platform":"Unreal Engine","publishedAt":"2026-03-12T08:47:34.000Z","updatedAt":"2026-04-19T15:44:48.000Z","sourceNotes":[],"fileContents":[],"compatibility":["Unreal Engine","Engine version: 4.25 - 4.27,5.0 - 5.3"],"featuredImage":{"alt":"SimpleCharts","src":"https://3dcghub.com/wp-content/uploads/2026/03/104a4c93-6ff6-445d-aad2-9588af9254de.webp"},"hasDownloadLink":true,"downloads":2},{"id":"1001169","slug":"safe-pawn","title":"Safe Pawn","category":"Engine Tools","engine":"5.2 - 5.7","assetVersion":"Asset Version: 1.0","engineVersion":"Engine Version: 5.2 - 5.7","tag":"Engine Tools","accent":"blue","visual":"mech","summary":"SafePawn for Unreal Engine 5 modifies the PlayerController to prevent automatic character pawn destruction when players leave persistent world games.","platform":"Unreal Engine","publishedAt":"2026-09-17T02:11:00.909Z","updatedAt":"2026-09-17T02:11:00.909Z","sourceNotes":[],"fileContents":[],"compatibility":["Unreal Engine","Asset Version: 1.0","Engine Version: 5.2 - 5.7"],"featuredImage":{"alt":"Safe Pawn","src":"/wp-content/uploads/published/2026/09/33a58fdd08cf-4a3c005b-b4e8-43cb-8bc7-9fac8cbc02da-78e913ae1b.webp"},"hasDownloadLink":true,"downloads":0}]}
Engine Tools
Thermodynamic Chart
Generate heat maps directly from data points in Unreal Engine. Set max/min intervals, add points, and color intensity grows with density. Supports high-precisio
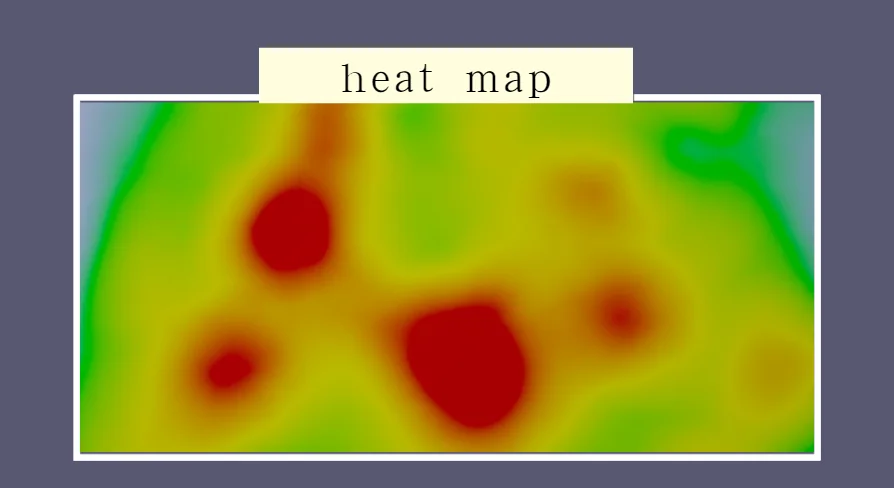
When a project needs to show how frequently events happen across a surface, raw data points alone are hard to read. A thermodynamic chart solves that by translating those points into a color gradient. In Unreal Engine, the Thermodynamic Chart plugin does exactly that: you define the value range, place your data, and the Map builds itself based on where points cluster.
Data Points and Color Intensity
The core mechanic is straightforward. You provide a maximum and minimum interval, then start adding data points into the middle of that range. The chart reads the density of points at any given location. The more points accumulate in 1 spot, the more obvious the color change becomes. That means a sparse area stays cool or muted, while a dense area pushes toward the hot end of the spectrum.
This interval-based setup makes the tool flexible. Instead of hard-coding color values for every coordinate, you work with a data-driven system. Adjust the interval, add or remove points, and the heat map updates accordingly. The workflow is simple and easy to use, which is 1 of the strengths mentioned for the plugin.
High-Precision Data and the Latitude/Longitude Use Case
1 detail that stands out is support for high-precision data, with latitude and longitude called out as an example. This matters for any production that deals with real-world geographic coordinates. Latitude and longitude values carry far more decimal precision than typical scene coordinates, and the chart can handle them without losing fidelity.
For teams working on Geographic Information System (GIS)-style visualizations, telemetry overlays, or location-based analytics, this opens a practical path. You can feed in coordinate pairs and see population density, incident frequency, or any other location-bound metric rendered as a heat map directly inside Unreal Engine. The high-precision support means you don't have to round or simplify the data before using it.
Finding the Asset in Unreal Engine's Content Browser
Getting started involves a quick Content Browser setup. In the upper-right corner of the Content Browser, click the Settings button. That opens a menu with options for the current instance. Under the View category, check the Show Plugin Content option. Once that's enabled, you can navigate to the Thermodynamic Chart > Content > Thermodynamic Chart directory.
That directory contains sample Levels and related assets. The samples give you a reference for how the chart behaves, how the data points are placed, and how the color output looks in a real scene. Having sample Levels included is a practical advantage because it shortens the learning curve. You can open a Level, inspect the setup, and adapt it to your own data.
Ground Fitting Update and Engine Version Support
The change log shows a May 2021 update that adds the option to fit to the ground. That feature is listed as pending approval, but it points directly to a common production need: heat maps that conform to Terrain instead of floating in space. When a chart can snap to the ground, it becomes much easier to integrate into exterior scenes, landscape-based visualizations, or urbanscape projects.
Earlier, in February 2021, version support was added for Unreal Engine 4.25 (UE4.25). This version compatibility is important for teams working on projects that have not yet migrated to newer engine releases. It means the Thermodynamic Chart can be used in a UE4.25-based pipeline without forcing an upgrade.
Who Gets the Most Value
The Thermodynamic Chart is aimed at anyone who needs to turn numerical data into visual insight inside Unreal Engine. Level Designers can use it to show danger zones or resource hotspots. Data visualization teams can map real-world statistics onto a surface. Researchers and urban planners working with latitude and longitude data will find the high-precision support particularly useful.
Because the core workflow is just setting an interval and adding points, it fits into rapid iteration. You can experiment with different data densities, adjust the range, and see the color response immediately. The included sample Levels reduce setup friction, and the ground-fitting option, once available, will make Terrain-based deployments even more straightforward.
For a production that needs a reliable, data-driven heat map without building the rendering logic from scratch, the Thermodynamic Chart offers a focused solution. It handles the mapping from data density to color, supports high-precision inputs, and slots directly into Unreal Engine's Content Browser workflow.
 Engine Tools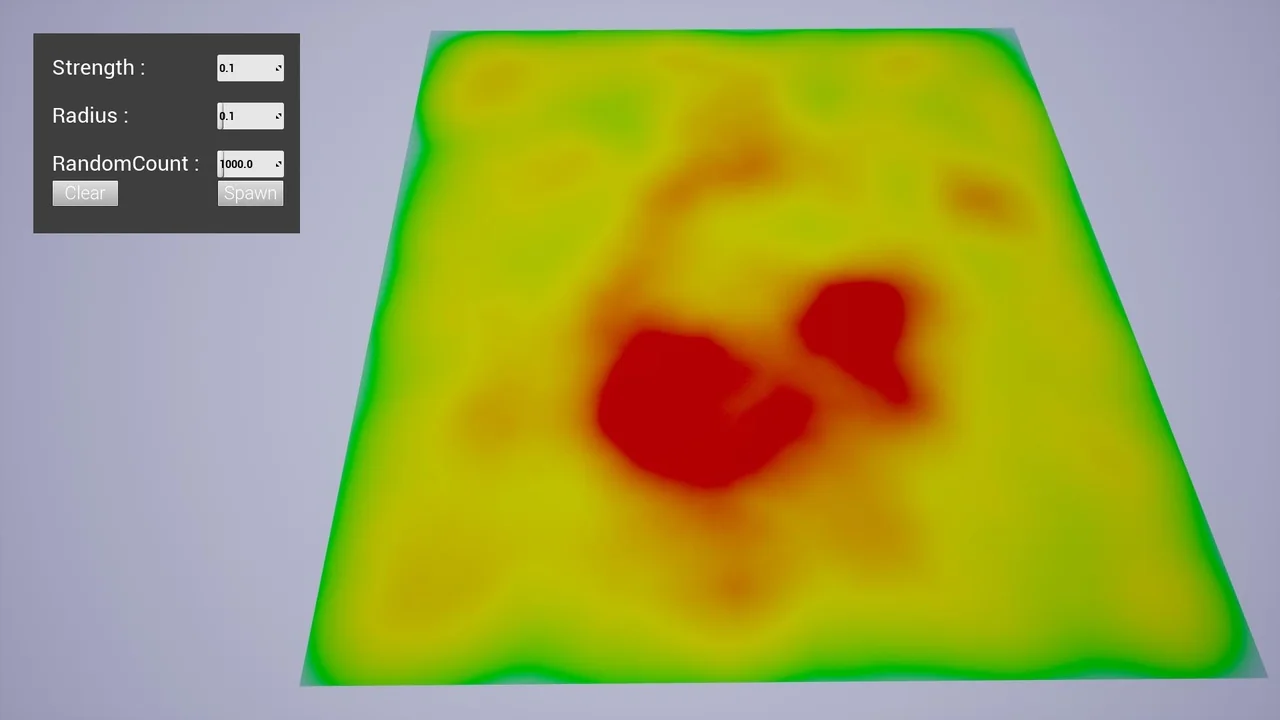
 Engine Tools
 Procedural Systems
 Engine Tools