"4481da9c895ef786"{"id":"1001322","slug":"collision-settings-debugger-2","title":"Collision Settings Debugger","category":"Engine Tools","engine":"5.2 - 5.8","assetVersion":"Asset Version: 1.0","engineVersion":"Engine Version: 5.2 - 5.8","tag":"Engine Tools","accent":"blue","visual":"mech","summary":"Inspect and verify primitive component collision settings in Unreal Engine using a dedicated Gameplay Debugger category and Blueprint query nodes.","platform":"Unreal Engine","publishedAt":"2026-10-02T09:47:46.569Z","updatedAt":"2026-10-02T09:47:46.569Z","sourceNotes":[],"fileContents":[],"compatibility":["Unreal Engine","Asset Version: 1.0","Engine Version: 5.2 - 5.8"],"featuredImage":{"alt":"Collision Settings Debugger","src":"/wp-content/uploads/published/2026/10/c67f33b2af27-cbdc50fb-4aa1-4656-9759-3b1f00b8d07e-1da0e85a65.webp"},"hasDownloadLink":true,"downloads":0,"terms":[{"taxonomy":"category","slug":"engine-tools-tools-and-plugins","name":"Engine Tools"}],"galleryImages":[{"src":"/wp-content/uploads/published/2026/10/1dc6e52bb1c5-e4ad0a26-64b6-49fa-b2cc-47eff278d479-51a57e3f51.webp","alt":"Collision Settings Debugger"},{"src":"/wp-content/uploads/published/2026/10/a8e1d3325b71-10312a0f-5758-4e06-9bad-65931efe1bfe-1933fee4f6.webp","alt":"Collision Settings Debugger"},{"src":"/wp-content/uploads/published/2026/10/bb070be1e1d0-8c1cb4bf-0d0d-4422-a0ed-9049b017c04b-58f3591913.webp","alt":"Collision Settings Debugger"},{"src":"/wp-content/uploads/published/2026/10/9fd6ca28ba92-8eccccbd-08e9-4a92-8a91-febc712b4fbf-6f0ab0bd86.webp","alt":"Collision Settings Debugger"},{"src":"/wp-content/uploads/published/2026/10/e724b6f811a4-7ac57d28-8496-400c-b2d4-f2dac9c0d3e9-fec4a9d01a.webp","alt":"Collision Settings Debugger"}],"accessPanel":{"kind":"resource","title":"Download this resource","eyebrow":"Free Download","message":"Log in or create a free account to start your download.","fileName":"Collision Settings Debugger.7z","safetyNote":"Resources are manually reviewed before listing to improve quality and reduce obvious risks.","actionLabel":"Download Free","resourceType":"Resource archive"},"contentHtml":"\u003ch2\u003eVisualizing Primitive Component Setup in the Gameplay Debugger\u003c/h2\u003e\n\u003cp\u003eFew development bottlenecks are as frustrating as setting up physical interactions, trace responses, and collision profiles only to discover that actors pass through geometry, block unintended channels, or fail to fire overlap events during testing. Primitive components form the backbone of collision detection in Unreal Engine, yet verifying their live configuration while a game is running often requires awkward workarounds or digging through deep property inspectors. Collision Settings Debugger directly addresses this friction by inserting a dedicated \"Collision\" category into the engine's built-in gameplay debugger interface.\u003c/p\u003e\n\u003cp\u003eBy registering directly with the gameplay debugger, the plugin allows developers to inspect the active collision settings of primitive components attached to target actors in real time. Instead of guessing whether a mesh, capsule, or box component retained its intended collision preset or had its collision responses altered by a script at runtime, the on-screen display prints out the exact collision properties of those primitive components. This live visibility ensures that unexpected behaviors—such as an actor failing to register a hit or falling through a floor—can be diagnosed instantly during play sessions without leaving the gameplay viewport.\u003c/p\u003e \u003ch2\u003eBlueprint Nodes for Querying and Printing Collision Setup\u003c/h2\u003e\n\u003cp\u003eIn addition to the visual overlay provided within the gameplay debugger, the plugin supplies a collection of Blueprint nodes designed to interact directly with collision configurations. These nodes give developers two primary capabilities: querying the current collision setup of a component and printing those details out on demand.\u003c/p\u003e\n\u003cp\u003eQuerying collision setup through visual scripting allows logic to verify states programmatically. If an actor changes its collision profile dynamically—such as when transitioning between grounded movement, swimming, ragdoll states, or mounting vehicles—Blueprint nodes can immediately inspect the underlying primitive component to verify that responses to specific trace channels and object types match design requirements. Pairing programmatic query nodes with printing nodes allows teams to route exact collision configuration data directly into custom logs, screen printouts, or automated check routines. This programmatic access eliminates the need to write custom C++ wrappers merely to inspect how a component is responding to world channels.\u003c/p\u003e \u003ch2\u003eTracking Down Unexpected Collision Behavior During Play\u003c/h2\u003e\n\u003cp\u003eMisconfigured collisions often stem from subtle conflicts between component hierarchies, inherited presets, and dynamic runtime modifications. An actor might possess a root primitive component alongside several child shapes, such as hitboxes, interaction radii, and weapon triggers. When collision configurations conflict across these nested elements, finding the specific primitive component that is dropping an overlap event or inappropriately blocking a camera trace can consume hours of debugging time.\u003c/p\u003e\n\u003cp\u003eUsing the gameplay debugger's \"Collision\" category, developers can point the debugger at any actor in the world and view the printed collision settings across its constituent primitive components. Because the readout details how components are actually configured at that precise frame, inconsistencies become obvious immediately. You can quickly see whether a primitive component has collision enabled, what object channel it belongs to, and how its response list handles dynamic objects in the scene. When paired with the Blueprint query and print nodes, dynamic shifts in collision parameters can be verified at the exact moment a script triggers them, pinpointing regressions before they compound into larger physics bugs.\u003c/p\u003e \u003ch2\u003eRuntime Inspection Built for Active Game Development\u003c/h2\u003e\n\u003cp\u003eThe utility of Collision Settings Debugger stems directly from practical necessity encountered during active game production. When building gameplay systems with complex interaction layers, developers frequently face scenarios where physics responses do not match the static settings chosen inside the editor viewport. Code modifications, animation notify states, and dynamic attachment logic routinely modify primitive components while the game is executing.\u003c/p\u003e\n\u003cp\u003eHaving an integrated gameplay debugger category ensures that collision state verification is always accessible with standard debugger hotkeys, requiring zero setup inside test levels. At the same time, the inclusion of dedicated Blueprint nodes ensures that developers who prefer script-driven diagnostic routines can print and query component setups directly within their event graphs. By pairing in-viewport debugger printing with scriptable Blueprint nodes, the tool provides a cohesive diagnostic toolkit for verifying collision behavior across characters, interactive objects, and physics-driven props throughout production.\u003c/p\u003e\n\n\u003ch2\u003eContinue Browsing Similar Packs\u003c/h2\u003e\n\u003cul\u003e\n\u003cli\u003e\u003ca href=\"https://3dcghub.com/collision-settings-debugger/\" title=\"Collision Settings Debugger\"\u003eCollision Settings Debugger\u003c/a\u003e\u003c/li\u003e\n\u003cli\u003e\u003ca href=\"https://3dcghub.com/auto-settings/\" title=\"Auto Settings\"\u003eAuto Settings\u003c/a\u003e\u003c/li\u003e\n\u003cli\u003e\u003ca href=\"https://3dcghub.com/cinematographer-pro-a-cinematic-photorealistic-camera-system/\" title=\"Cinematographer PRO - A Cinematic Photorealistic Camera System\"\u003eCinematographer PRO - A Cinematic Photorealistic Camera System\u003c/a\u003e\u003c/li\u003e\n\u003cli\u003e\u003ca href=\"https://3dcghub.com/did-it-hit-trace-detection-plugin/\" title=\"Did it hit - Trace Detection Plugin\"\u003eDid it hit - Trace Detection Plugin\u003c/a\u003e\u003c/li\u003e\n\u003cli\u003e\u003ca href=\"https://3dcghub.com/physics-collision-sound/\" title=\"Physics Collision Sound\"\u003ePhysics Collision Sound\u003c/a\u003e\u003c/li\u003e\n\u003c/ul\u003e","contentTextLength":5126,"navigation":{"current":18,"total":3269,"previous":{"id":"1001323","slug":"custom-details-sections","title":"Custom Details Sections","category":"Engine Tools","platform":"Unreal Engine","updatedAt":"2026-10-02T09:50:11.134Z"},"next":{"id":"1001321","slug":"clipboard-copy-and-paste","title":"Clipboard - Copy and Paste","category":"Engine Tools","platform":"Unreal Engine","updatedAt":"2026-10-02T09:45:44.117Z"}},"relatedResources":[{"id":"1001265","slug":"collision-settings-debugger","title":"Collision Settings Debugger","category":"Engine Tools","engine":"5.2 - 5.8","assetVersion":"Asset Version: 1.0","engineVersion":"Engine Version: 5.2 - 5.8","tag":"Engine Tools","accent":"blue","visual":"mech","summary":"Inspect primitive component collisions with Collision Settings Debugger, featuring a Gameplay Debugger category and dedicated Blueprint query nodes.","platform":"Unreal Engine","publishedAt":"2026-09-30T05:43:51.525Z","updatedAt":"2026-09-30T05:43:51.525Z","sourceNotes":[],"fileContents":[],"compatibility":["Unreal Engine","Asset Version: 1.0","Engine Version: 5.2 - 5.8"],"featuredImage":{"alt":"Collision Settings Debugger","src":"/wp-content/uploads/published/2026/09/c67f33b2af27-cbdc50fb-4aa1-4656-9759-3b1f00b8d07e-8d276138cc.webp"},"hasDownloadLink":true,"downloads":0},{"id":"13723","slug":"auto-settings","title":"Auto Settings","category":"Engine Tools","engine":"5.6","assetVersion":"Engine version: 5.6","engineVersion":"Asset Version:1.31.0","tag":"Engine Tools","accent":"blue","visual":"character","summary":"Auto Settings is a highly configurable toolkit for Unreal Engine designed to streamline the creation of game options and input binding menus without code.","platform":"Unreal Engine","publishedAt":"2026-03-11T09:48:29.000Z","updatedAt":"2026-04-19T15:46:23.000Z","sourceNotes":[],"fileContents":[],"compatibility":["Unreal Engine","Engine version: 5.6","Asset Version: 1.31.0"],"featuredImage":{"alt":"Auto Settings","src":"https://3dcghub.com/wp-content/uploads/2026/03/25a4d182-718a-444e-823a-6b7e680c21f2.webp"},"hasDownloadLink":true,"downloads":0},{"id":"1001327","slug":"subsystem-configuration-integration","title":"Subsystem Configuration Integration","category":"Engine Tools","engine":"5.1 - 5.8","assetVersion":"Asset Version: 1.3 - 1.4","engineVersion":"Engine Version: 5.1 - 5.8","tag":"Engine Tools","accent":"blue","visual":"mech","summary":"Simplify Steam settings in Unreal Engine with Subsystem Configuration Integration, featuring instant saving, editor access, and Spacewar AppID support.","platform":"Unreal Engine","publishedAt":"2026-10-02T09:57:47.200Z","updatedAt":"2026-10-02T09:57:47.200Z","sourceNotes":[],"fileContents":[],"compatibility":["Unreal Engine","Asset Version: 1.3 - 1.4","Engine Version: 5.1 - 5.8"],"featuredImage":{"alt":"Subsystem Configuration Integration","src":"/wp-content/uploads/published/2026/10/02c4f4ee1a61-2d05158c-28f6-4b57-82a2-f565e5de4708-07ada81efa.webp"},"hasDownloadLink":true,"downloads":0}]}
Engine Tools
Collision Settings Debugger
Inspect and verify primitive component collision settings in Unreal Engine using a dedicated Gameplay Debugger category and Blueprint query nodes.
Visualizing Primitive Component Setup in the Gameplay Debugger
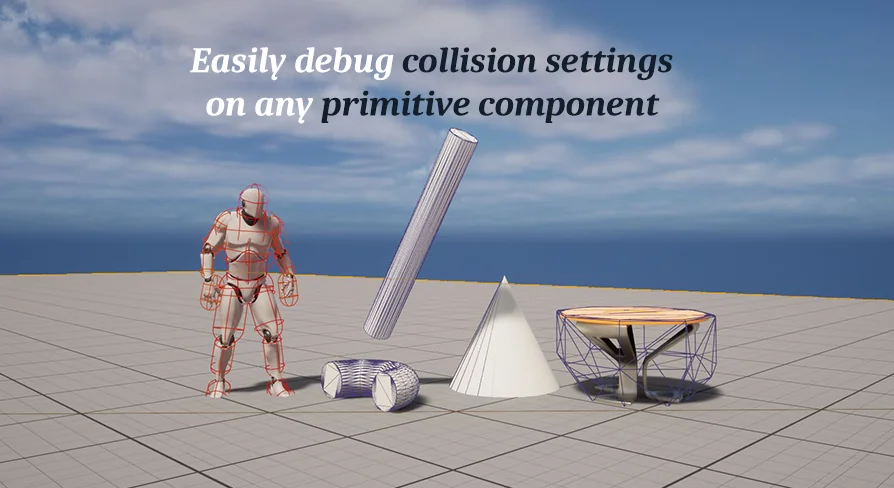
Few development bottlenecks are as frustrating as setting up physical interactions, trace responses, and collision profiles only to discover that actors pass through geometry, block unintended channels, or fail to fire overlap events during testing. Primitive components form the backbone of collision detection in Unreal Engine, yet verifying their live configuration while a game is running often requires awkward workarounds or digging through deep property inspectors. Collision Settings Debugger directly addresses this friction by inserting a dedicated "Collision" category into the engine's built-in gameplay debugger interface.
By registering directly with the gameplay debugger, the plugin allows developers to inspect the active collision settings of primitive components attached to target actors in real time. Instead of guessing whether a mesh, capsule, or box component retained its intended collision preset or had its collision responses altered by a script at runtime, the on-screen display prints out the exact collision properties of those primitive components. This live visibility ensures that unexpected behaviors—such as an actor failing to register a hit or falling through a floor—can be diagnosed instantly during play sessions without leaving the gameplay viewport.
Blueprint Nodes for Querying and Printing Collision Setup
In addition to the visual overlay provided within the gameplay debugger, the plugin supplies a collection of Blueprint nodes designed to interact directly with collision configurations. These nodes give developers two primary capabilities: querying the current collision setup of a component and printing those details out on demand.
Querying collision setup through visual scripting allows logic to verify states programmatically. If an actor changes its collision profile dynamically—such as when transitioning between grounded movement, swimming, ragdoll states, or mounting vehicles—Blueprint nodes can immediately inspect the underlying primitive component to verify that responses to specific trace channels and object types match design requirements. Pairing programmatic query nodes with printing nodes allows teams to route exact collision configuration data directly into custom logs, screen printouts, or automated check routines. This programmatic access eliminates the need to write custom C++ wrappers merely to inspect how a component is responding to world channels.
Tracking Down Unexpected Collision Behavior During Play
Misconfigured collisions often stem from subtle conflicts between component hierarchies, inherited presets, and dynamic runtime modifications. An actor might possess a root primitive component alongside several child shapes, such as hitboxes, interaction radii, and weapon triggers. When collision configurations conflict across these nested elements, finding the specific primitive component that is dropping an overlap event or inappropriately blocking a camera trace can consume hours of debugging time.
Using the gameplay debugger's "Collision" category, developers can point the debugger at any actor in the world and view the printed collision settings across its constituent primitive components. Because the readout details how components are actually configured at that precise frame, inconsistencies become obvious immediately. You can quickly see whether a primitive component has collision enabled, what object channel it belongs to, and how its response list handles dynamic objects in the scene. When paired with the Blueprint query and print nodes, dynamic shifts in collision parameters can be verified at the exact moment a script triggers them, pinpointing regressions before they compound into larger physics bugs.
Runtime Inspection Built for Active Game Development
The utility of Collision Settings Debugger stems directly from practical necessity encountered during active game production. When building gameplay systems with complex interaction layers, developers frequently face scenarios where physics responses do not match the static settings chosen inside the editor viewport. Code modifications, animation notify states, and dynamic attachment logic routinely modify primitive components while the game is executing.
Having an integrated gameplay debugger category ensures that collision state verification is always accessible with standard debugger hotkeys, requiring zero setup inside test levels. At the same time, the inclusion of dedicated Blueprint nodes ensures that developers who prefer script-driven diagnostic routines can print and query component setups directly within their event graphs. By pairing in-viewport debugger printing with scriptable Blueprint nodes, the tool provides a cohesive diagnostic toolkit for verifying collision behavior across characters, interactive objects, and physics-driven props throughout production.
 Engine Tools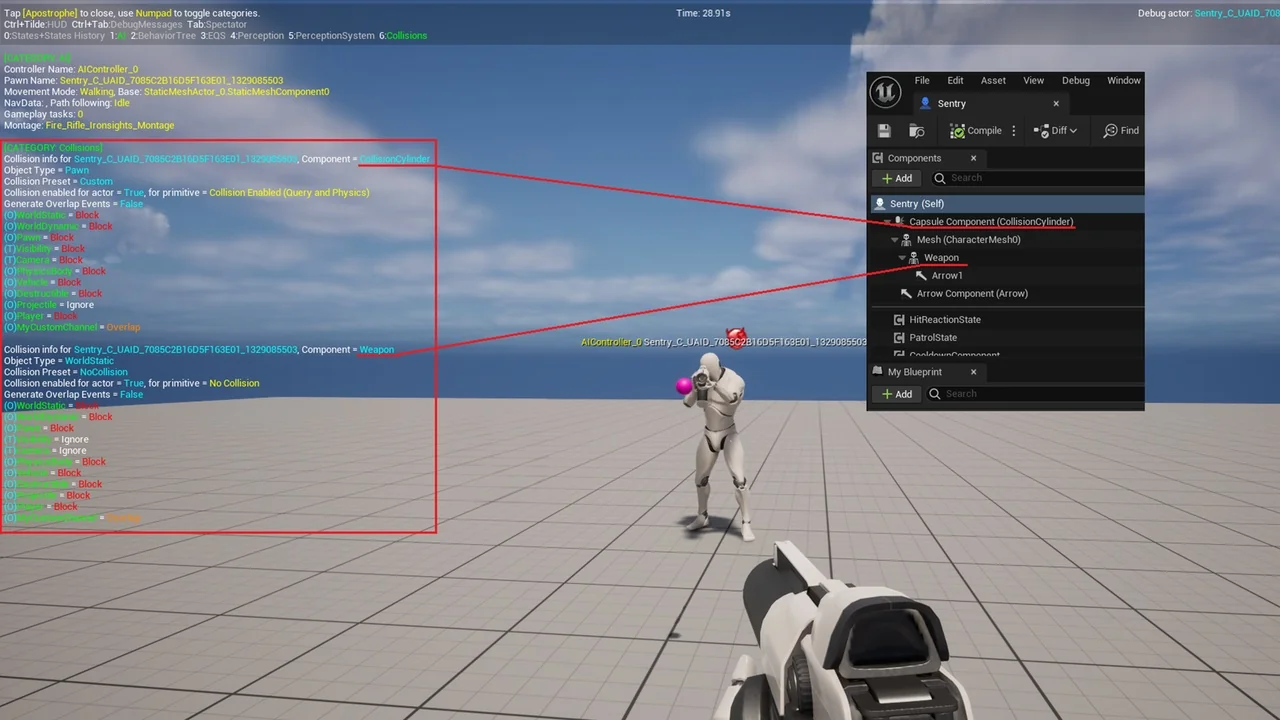
 Engine Tools
 Engine Tools
 Engine Tools