"1f00f67f9253451b"{"id":"1001265","slug":"collision-settings-debugger","title":"Collision Settings Debugger","category":"Engine Tools","engine":"5.2 - 5.8","assetVersion":"Asset Version: 1.0","engineVersion":"Engine Version: 5.2 - 5.8","tag":"Engine Tools","accent":"blue","visual":"mech","summary":"Inspect primitive component collisions with Collision Settings Debugger, featuring a Gameplay Debugger category and dedicated Blueprint query nodes.","platform":"Unreal Engine","publishedAt":"2026-09-30T05:43:51.525Z","updatedAt":"2026-09-30T05:43:51.525Z","sourceNotes":[],"fileContents":[],"compatibility":["Unreal Engine","Asset Version: 1.0","Engine Version: 5.2 - 5.8"],"featuredImage":{"alt":"Collision Settings Debugger","src":"/wp-content/uploads/published/2026/09/c67f33b2af27-cbdc50fb-4aa1-4656-9759-3b1f00b8d07e-8d276138cc.webp"},"hasDownloadLink":true,"downloads":0,"terms":[{"taxonomy":"category","slug":"engine-tools-tools-and-plugins","name":"Engine Tools"}],"galleryImages":[{"src":"/wp-content/uploads/published/2026/09/1dc6e52bb1c5-e4ad0a26-64b6-49fa-b2cc-47eff278d479-407f134de0.webp","alt":"Collision Settings Debugger"},{"src":"/wp-content/uploads/published/2026/09/a8e1d3325b71-10312a0f-5758-4e06-9bad-65931efe1bfe-12393ca6be.webp","alt":"Collision Settings Debugger"},{"src":"/wp-content/uploads/published/2026/09/bb070be1e1d0-8c1cb4bf-0d0d-4422-a0ed-9049b017c04b-672ad069c6.webp","alt":"Collision Settings Debugger"},{"src":"/wp-content/uploads/published/2026/09/9fd6ca28ba92-8eccccbd-08e9-4a92-8a91-febc712b4fbf-c619dcfa2a.webp","alt":"Collision Settings Debugger"},{"src":"/wp-content/uploads/published/2026/09/e724b6f811a4-7ac57d28-8496-400c-b2d4-f2dac9c0d3e9-892b9bc857.webp","alt":"Collision Settings Debugger"}],"accessPanel":{"kind":"resource","title":"Download this resource","eyebrow":"Free Download","message":"Log in or create a free account to start your download.","fileName":"Collision Settings Debugger.7z","safetyNote":"Resources are manually reviewed before listing to improve quality and reduce obvious risks.","actionLabel":"Download Free","resourceType":"Resource archive"},"contentHtml":"\u003ch2\u003eDiagnosing Primitive Component Collisions in Real Time\u003c/h2\u003e\n\u003cp\u003eSetting up collision responses across actors and primitive components frequently leads to situations where physics interactions, hit events, or overlap traces fail without an obvious visual cause. Primitive components rely on precise channel responses, object types, and collision enabled states. When an interaction fails in the middle of gameplay, verifying which specific primitive component holds the incorrect profile often turns into a tedious process of opening actor blueprints, checking individual component details panels, and guessing where the mismatch occurred.\u003c/p\u003e\n\u003cp\u003eCollision Settings Debugger addresses this breakdown by placing collision verification directly inside the runtime environment. Instead of stopping execution to sift through static settings in the editor viewport, the plugin provides immediate insight into the active configuration of primitive components while the project is running. The tool exposes whether a component is set to block, overlap, or ignore specific channels, giving developers a direct window into the actual values running in memory.\u003c/p\u003e \u003ch2\u003eThe Gameplay Debugger Collision Category\u003c/h2\u003e\n\u003cp\u003eThe core interface of the plugin attaches directly to the engine's built-in gameplay debugger framework. Collision Settings Debugger introduces a dedicated \"Collision\" debug category that can be activated on the fly during gameplay sessions.\u003c/p\u003e\n\u003cp\u003eOnce toggled, the Collision category prints collision settings for primitive components directly on the screen. Because the data renders within the gameplay debugger overlay, developers can move through a scene, target specific entities, and review the exact collision states assigned to individual primitive components without cluttering standard viewport view modes. This provides immediate visual confirmation of how components are configured relative to surrounding actors, eliminating the guesswork when traces pass through geometry or overlaps fail to register.\u003c/p\u003e \u003ch2\u003eBlueprint Nodes for Querying and Printing Collision Setup\u003c/h2\u003e\n\u003cp\u003eIn addition to the visual HUD integration provided by the gameplay debugger, Collision Settings Debugger includes a collection of Blueprint nodes created specifically to query and print collision setups programmatically. These nodes expand debugging workflows beyond manual observation by allowing developers to integrate collision checks into their game logic.\u003c/p\u003e\n\u003cp\u003eUsing the provided Blueprint nodes, developers can:\u003c/p\u003e\n\u003cul\u003e \u003cli\u003eQuery the exact collision setup of a primitive component at runtime to evaluate active responses in script.\u003c/li\u003e \u003cli\u003ePrint collision setup information to the log or on-screen output when specific gameplay conditions or testing triggers are met.\u003c/li\u003e \u003cli\u003eInspect dynamic changes when actors change their collision presets during runtime events, stance adjustments, or state shifts.\u003c/li\u003e\n\u003c/ul\u003e\n\u003cp\u003eHaving dedicated nodes to query collision data allows teams to script diagnostic routines into test levels. When a test character fails an interaction test, a Blueprint graph can execute the query node to isolate whether the primitive component was set to the wrong channel response before passing the data to the print node for immediate review.\u003c/p\u003e \u003ch2\u003eBuilt from Practical Production Needs\u003c/h2\u003e\n\u003cp\u003eCollision Settings Debugger was created directly out of practical frustration encountered during active project development. When collision configurations do not work as expected, tracking down which component carries the offending flag slows down implementation. The developer developed this toolset specifically to solve that issue within their own game project, ensuring the tool answers genuine testing requirements rather than theoretical use cases.\u003c/p\u003e\n\u003cp\u003eBecause the utility originated in a live game workflow, its functions focus on fast, direct data retrieval. The integration with the gameplay debugger keeps the profiling lightweight and instantly accessible via existing debug inputs, while the Blueprint nodes allow rapid verification without writing custom C++ diagnostic helpers. The plugin maintains verified compatibility with State Component - Organize Any Game Logic, allowing teams organizing their architecture around state components to cleanly debug collision transitions as game states change.\u003c/p\u003e \u003ch2\u003eTargeted Troubleshooting Workflows\u003c/h2\u003e\n\u003cp\u003eProjects featuring multi-component actors—such as characters with separate hurtboxes, interaction volumes, and physics hulls—frequently suffer from overlapping collision definitions that conflict with each other. By running Collision Settings Debugger, developers can isolate each primitive component on an actor to verify that interaction volumes are strictly querying the intended channels while structural meshes maintain appropriate blocking rules.\u003c/p\u003e\n\u003cp\u003eThe combination of an on-screen gameplay debugger category and runtime Blueprint nodes provides both passive and active verification pathways. Whether monitoring primitive components during live traversal or printing collision setups from scripted test routines, Collision Settings Debugger turns silent collision failures into clearly readable data.\u003c/p\u003e\n\n\u003ch2\u003eExplore Similar Assets\u003c/h2\u003e\n\u003cul\u003e\n\u003cli\u003e\u003ca href=\"https://3dcghub.com/auto-settings/\" title=\"Auto Settings\"\u003eAuto Settings\u003c/a\u003e\u003c/li\u003e\n\u003cli\u003e\u003ca href=\"https://3dcghub.com/cinematographer-pro-a-cinematic-photorealistic-camera-system/\" title=\"Cinematographer PRO - A Cinematic Photorealistic Camera System\"\u003eCinematographer PRO - A Cinematic Photorealistic Camera System\u003c/a\u003e\u003c/li\u003e\n\u003cli\u003e\u003ca href=\"https://3dcghub.com/did-it-hit-trace-detection-plugin/\" title=\"Did it hit - Trace Detection Plugin\"\u003eDid it hit - Trace Detection Plugin\u003c/a\u003e\u003c/li\u003e\n\u003cli\u003e\u003ca href=\"https://3dcghub.com/physics-collision-sound/\" title=\"Physics Collision Sound\"\u003ePhysics Collision Sound\u003c/a\u003e\u003c/li\u003e\n\u003cli\u003e\u003ca href=\"https://3dcghub.com/proinstance-tools-plugin/\" title=\"ProInstance Tools Plugin\"\u003eProInstance Tools Plugin\u003c/a\u003e\u003c/li\u003e\n\u003c/ul\u003e","contentTextLength":5239,"navigation":{"current":17,"total":3222,"previous":{"id":"1000587","slug":"dlc-in-blueprints","title":"DLC in Blueprints","category":"Engine Tools","platform":"Unreal Engine","updatedAt":"2026-09-30T05:45:19.996Z"},"next":{"id":"1001264","slug":"blueprint-cheat-manager-pro","title":"Blueprint Cheat Manager Pro","category":"Engine Tools","platform":"Unreal Engine","updatedAt":"2026-09-30T05:42:15.265Z"}},"relatedResources":[{"id":"13723","slug":"auto-settings","title":"Auto Settings","category":"Engine Tools","engine":"5.6","assetVersion":"Engine version: 5.6","engineVersion":"Asset Version:1.31.0","tag":"Engine Tools","accent":"blue","visual":"character","summary":"Auto Settings is a highly configurable toolkit for Unreal Engine designed to streamline the creation of game options and input binding menus without code.","platform":"Unreal Engine","publishedAt":"2026-03-11T09:48:29.000Z","updatedAt":"2026-04-19T15:46:23.000Z","sourceNotes":[],"fileContents":[],"compatibility":["Unreal Engine","Engine version: 5.6","Asset Version: 1.31.0"],"featuredImage":{"alt":"Auto Settings","src":"https://3dcghub.com/wp-content/uploads/2026/03/25a4d182-718a-444e-823a-6b7e680c21f2.webp"},"hasDownloadLink":true,"downloads":0},{"id":"13799","slug":"cinematographer-pro-a-cinematic-photorealistic-camera-system","title":"Cinematographer PRO - A Cinematic Photorealistic Camera System","category":"Engine Tools","engine":"5.1 - 5.7","assetVersion":"1.03 - 1.2","engineVersion":"5.1 - 5.7","tag":"Engine Tools","accent":"blue","visual":"character","summary":"Enhance your Unreal Engine workflow with Cinematographer PRO. This system offers realistic camera gear and streamlined settings to achieve instant photorealistic results for any project.","platform":"Unreal Engine","publishedAt":"2026-03-11T10:06:56.000Z","updatedAt":"2026-07-26T15:56:12.234Z","sourceNotes":[],"fileContents":[],"compatibility":["Unreal Engine","Asset Version: 1.03 - 1.2","Engine version: 5.1 - 5.7"],"featuredImage":{"alt":"Cinematographer PRO - A Cinematic Photorealistic Camera System","src":"https://3dcghub.com/wp-content/uploads/2026/03/45c81bf9-4e58-4b53-b6f6-e8802264d091.webp"},"hasDownloadLink":true,"downloads":2},{"id":"13853","slug":"did-it-hit-trace-detection-plugin","title":"Did it hit - Trace Detection Plugin","category":"Engine Tools","engine":"4.25 - 5.8","assetVersion":"Asset Version:1.1.0 - 1.5","engineVersion":"Engine version: 4.25 - 5.8","tag":"Engine Tools","accent":"blue","visual":"luts","summary":"Solve the issue of skipped collisions in fast-paced games. This plugin provides a high-performance tracing system for bullets and weapon swings that standard colliders might miss.","platform":"Unreal Engine","publishedAt":"2026-03-11T10:23:29.000Z","updatedAt":"2026-09-29T08:41:33.282Z","sourceNotes":[],"fileContents":[],"compatibility":["Unreal Engine","Asset Version:1.1.0 - 1.5","Engine version: 4.25 - 5.8"],"featuredImage":{"alt":"Did it hit - Trace Detection Plugin","src":"https://3dcghub.com/wp-content/uploads/2026/03/bd3e4c0f-52b7-4c26-a033-df949ae21c94.webp"},"hasDownloadLink":true,"downloads":0}]}
Engine Tools
Collision Settings Debugger
Inspect primitive component collisions with Collision Settings Debugger, featuring a Gameplay Debugger category and dedicated Blueprint query nodes.
Diagnosing Primitive Component Collisions in Real Time
Setting up collision responses across actors and primitive components frequently leads to situations where physics interactions, hit events, or overlap traces fail without an obvious visual cause. Primitive components rely on precise channel responses, object types, and collision enabled states. When an interaction fails in the middle of gameplay, verifying which specific primitive component holds the incorrect profile often turns into a tedious process of opening actor blueprints, checking individual component details panels, and guessing where the mismatch occurred.
Collision Settings Debugger addresses this breakdown by placing collision verification directly inside the runtime environment. Instead of stopping execution to sift through static settings in the editor viewport, the plugin provides immediate insight into the active configuration of primitive components while the project is running. The tool exposes whether a component is set to block, overlap, or ignore specific channels, giving developers a direct window into the actual values running in memory.
The Gameplay Debugger Collision Category
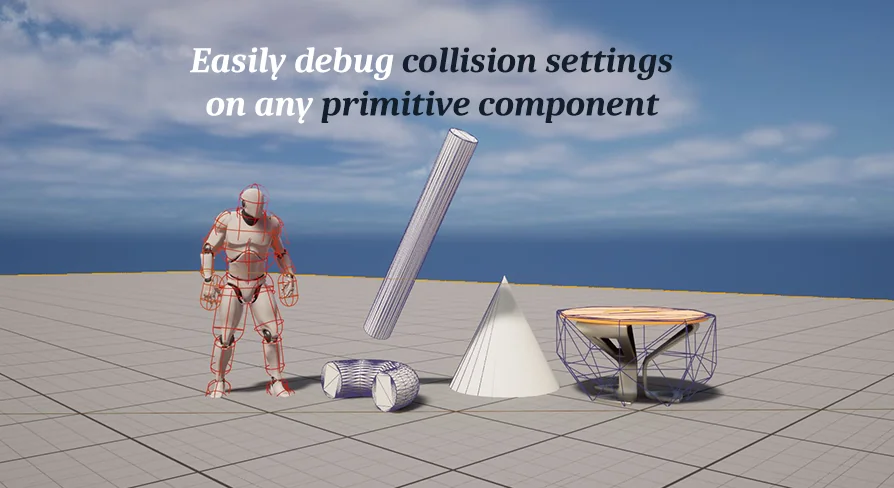
The core interface of the plugin attaches directly to the engine's built-in gameplay debugger framework. Collision Settings Debugger introduces a dedicated "Collision" debug category that can be activated on the fly during gameplay sessions.
Once toggled, the Collision category prints collision settings for primitive components directly on the screen. Because the data renders within the gameplay debugger overlay, developers can move through a scene, target specific entities, and review the exact collision states assigned to individual primitive components without cluttering standard viewport view modes. This provides immediate visual confirmation of how components are configured relative to surrounding actors, eliminating the guesswork when traces pass through geometry or overlaps fail to register.
Blueprint Nodes for Querying and Printing Collision Setup
In addition to the visual HUD integration provided by the gameplay debugger, Collision Settings Debugger includes a collection of Blueprint nodes created specifically to query and print collision setups programmatically. These nodes expand debugging workflows beyond manual observation by allowing developers to integrate collision checks into their game logic.
Using the provided Blueprint nodes, developers can:
Query the exact collision setup of a primitive component at runtime to evaluate active responses in script.
Print collision setup information to the log or on-screen output when specific gameplay conditions or testing triggers are met.
Inspect dynamic changes when actors change their collision presets during runtime events, stance adjustments, or state shifts.
Having dedicated nodes to query collision data allows teams to script diagnostic routines into test levels. When a test character fails an interaction test, a Blueprint graph can execute the query node to isolate whether the primitive component was set to the wrong channel response before passing the data to the print node for immediate review.
Built from Practical Production Needs
Collision Settings Debugger was created directly out of practical frustration encountered during active project development. When collision configurations do not work as expected, tracking down which component carries the offending flag slows down implementation. The developer developed this toolset specifically to solve that issue within their own game project, ensuring the tool answers genuine testing requirements rather than theoretical use cases.
Because the utility originated in a live game workflow, its functions focus on fast, direct data retrieval. The integration with the gameplay debugger keeps the profiling lightweight and instantly accessible via existing debug inputs, while the Blueprint nodes allow rapid verification without writing custom C++ diagnostic helpers. The plugin maintains verified compatibility with State Component - Organize Any Game Logic, allowing teams organizing their architecture around state components to cleanly debug collision transitions as game states change.
Targeted Troubleshooting Workflows
Projects featuring multi-component actors—such as characters with separate hurtboxes, interaction volumes, and physics hulls—frequently suffer from overlapping collision definitions that conflict with each other. By running Collision Settings Debugger, developers can isolate each primitive component on an actor to verify that interaction volumes are strictly querying the intended channels while structural meshes maintain appropriate blocking rules.
The combination of an on-screen gameplay debugger category and runtime Blueprint nodes provides both passive and active verification pathways. Whether monitoring primitive components during live traversal or printing collision setups from scripted test routines, Collision Settings Debugger turns silent collision failures into clearly readable data.
 Engine Tools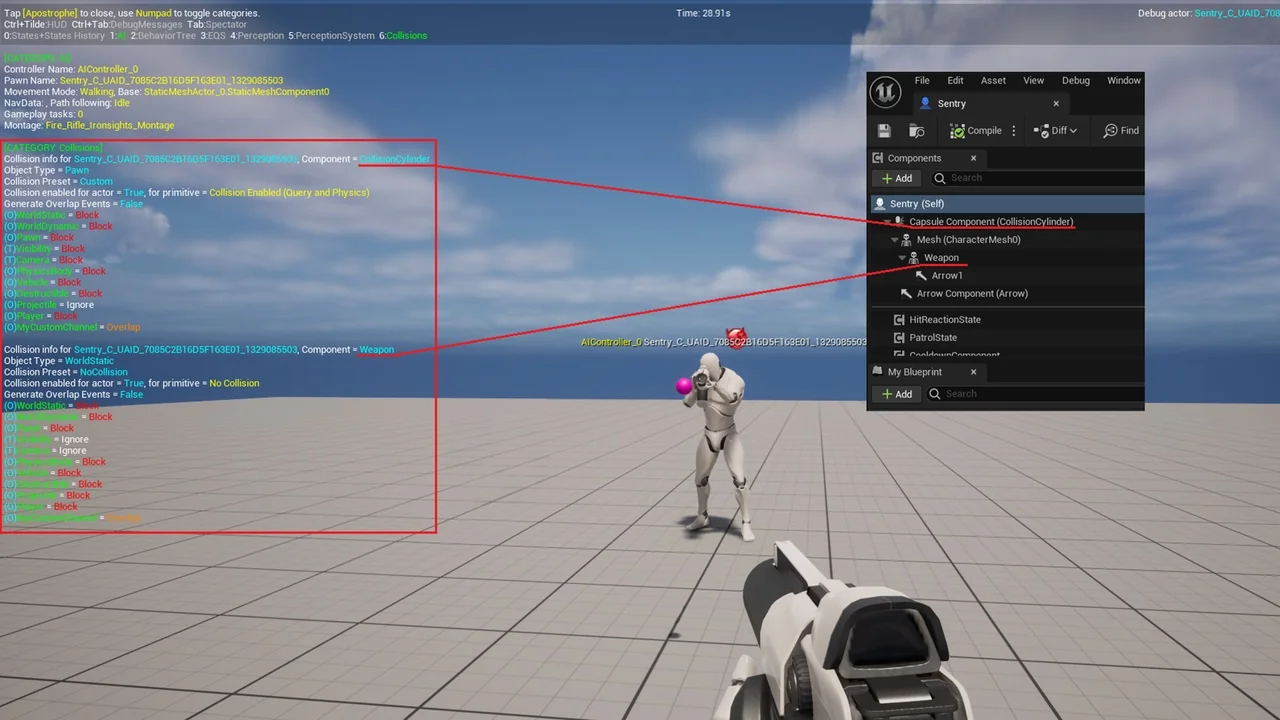
 Engine Tools
 Engine Tools
 Engine Tools