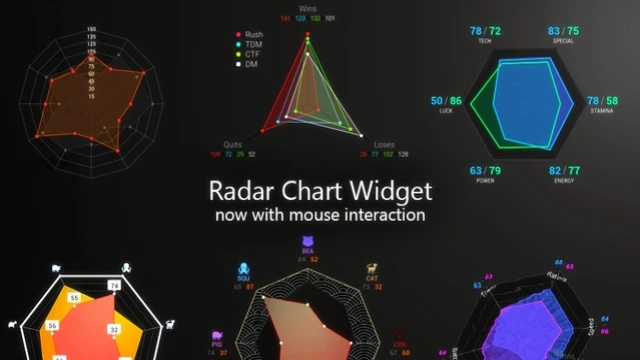
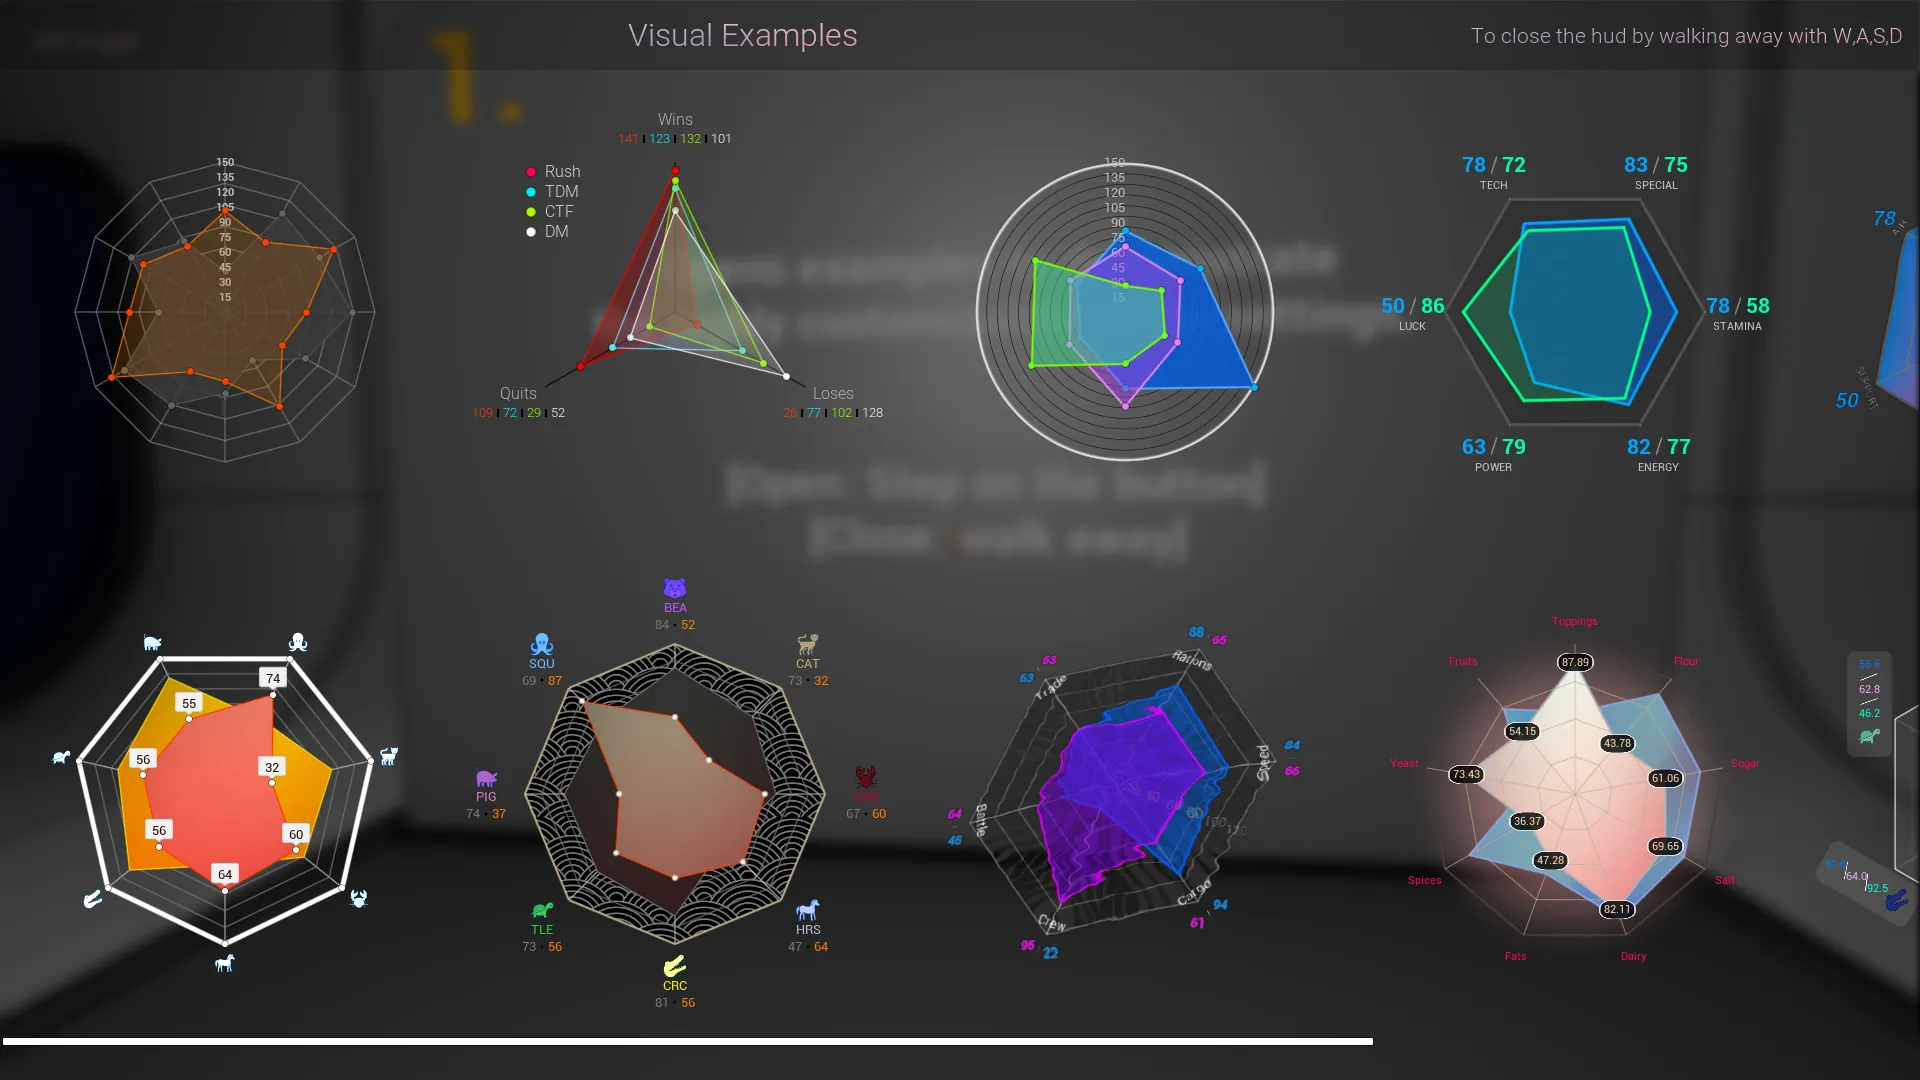
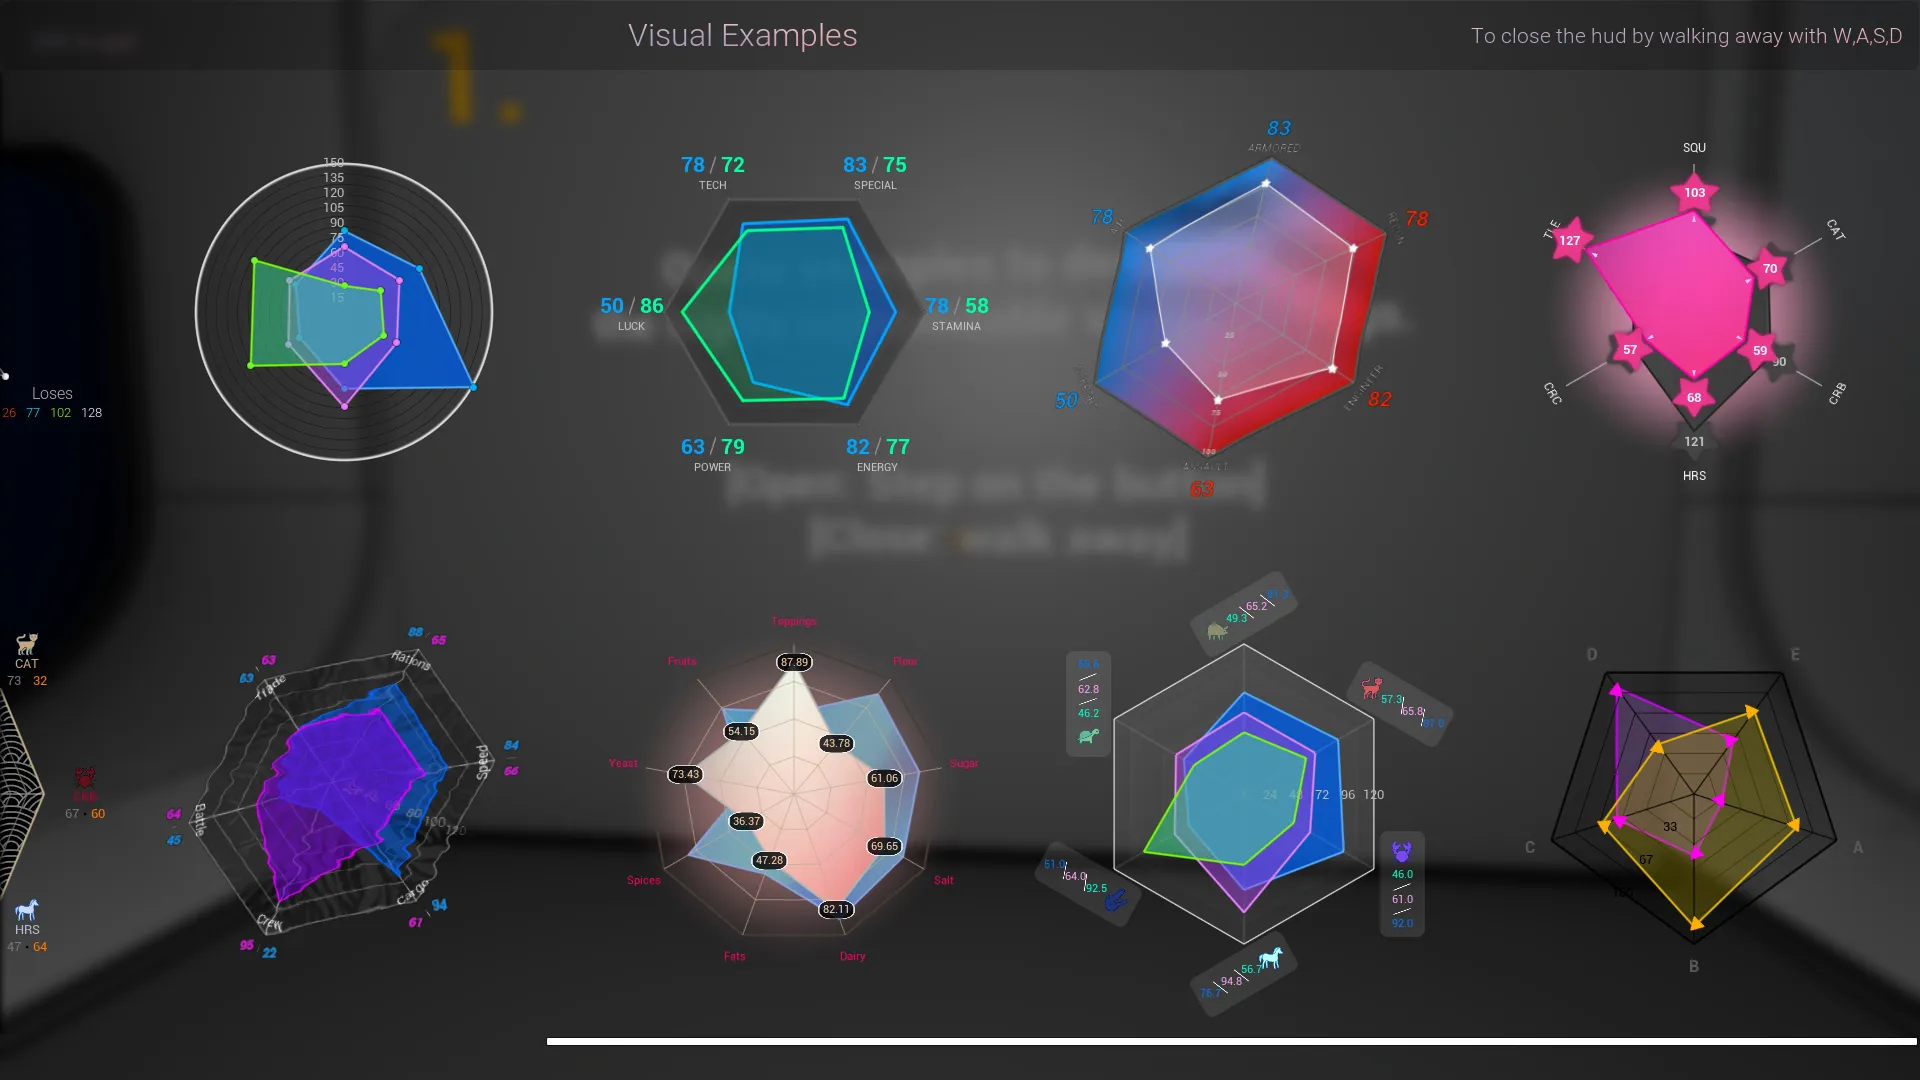
Highly customizeable Radar Chart Widget with mouse interaction
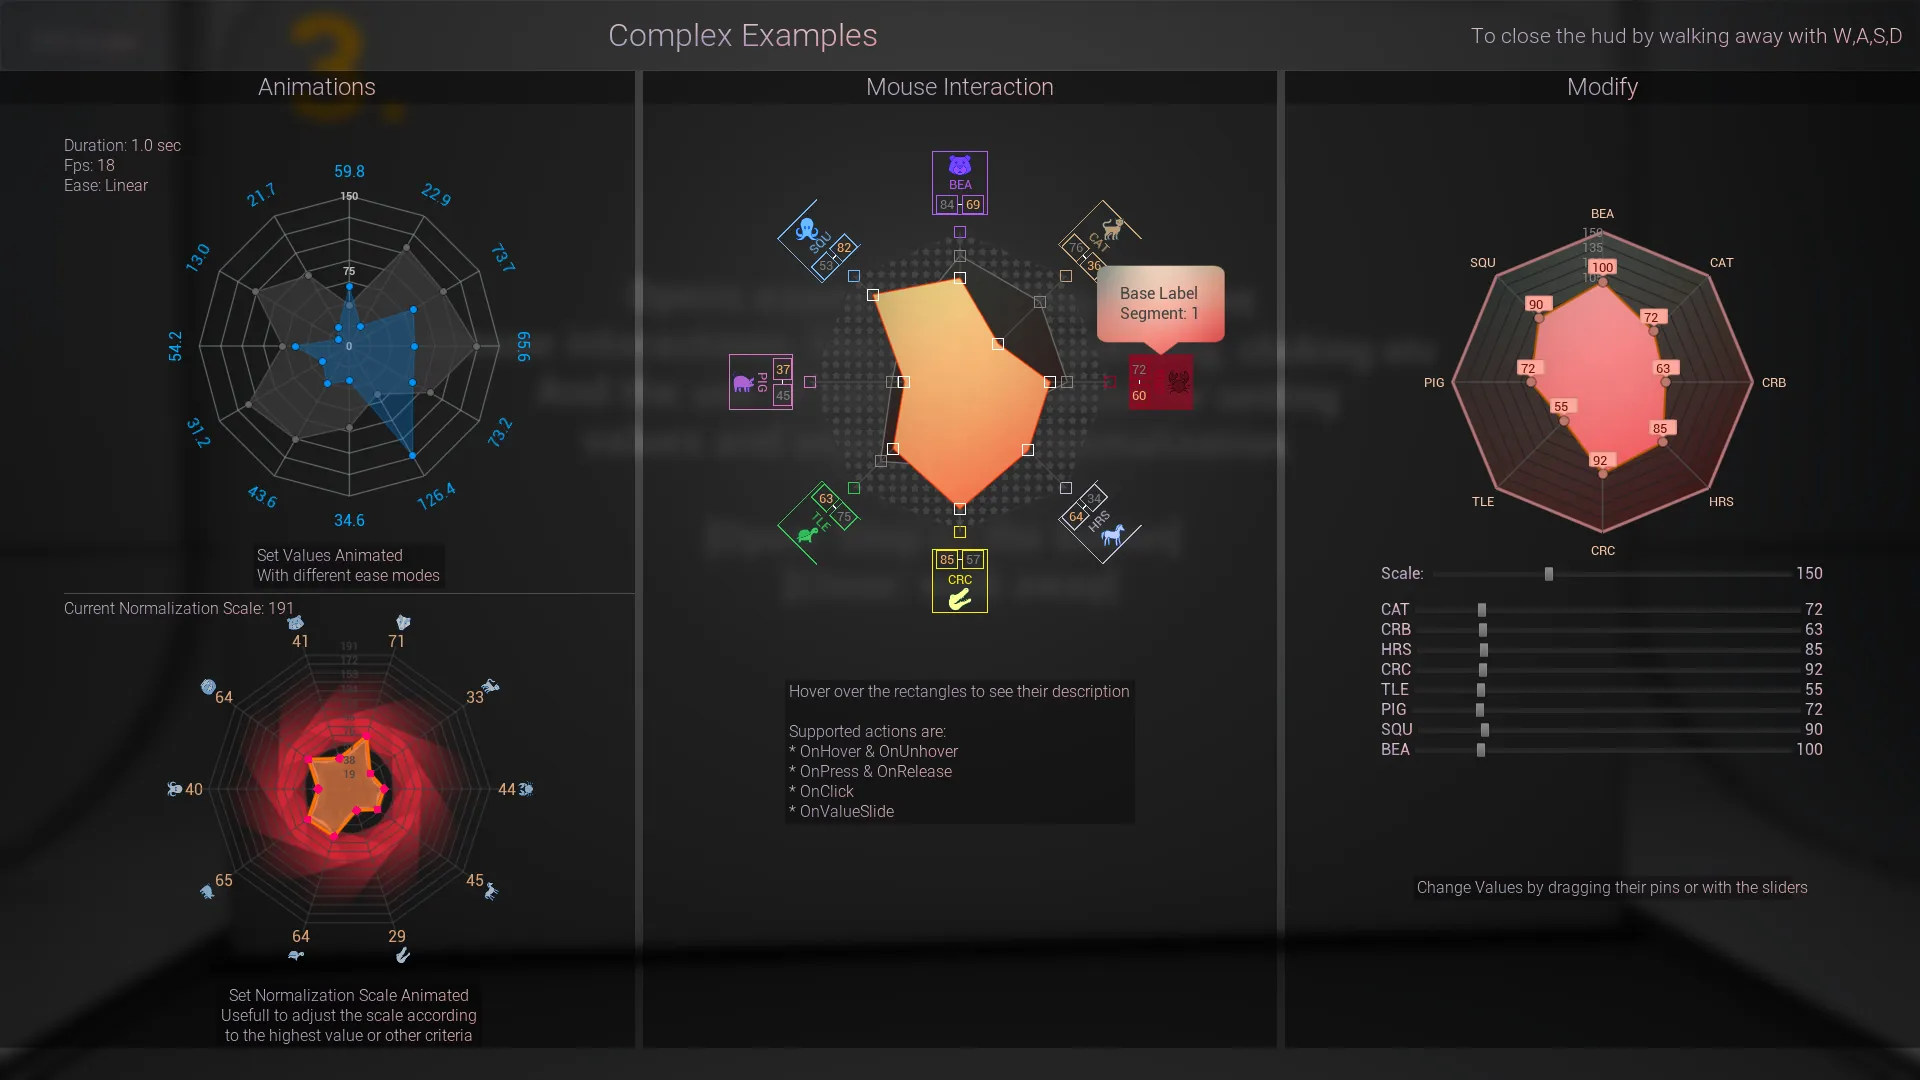
This type of chart is useful to visualize data in an easy to understand and compareable matter to the player.
Features:
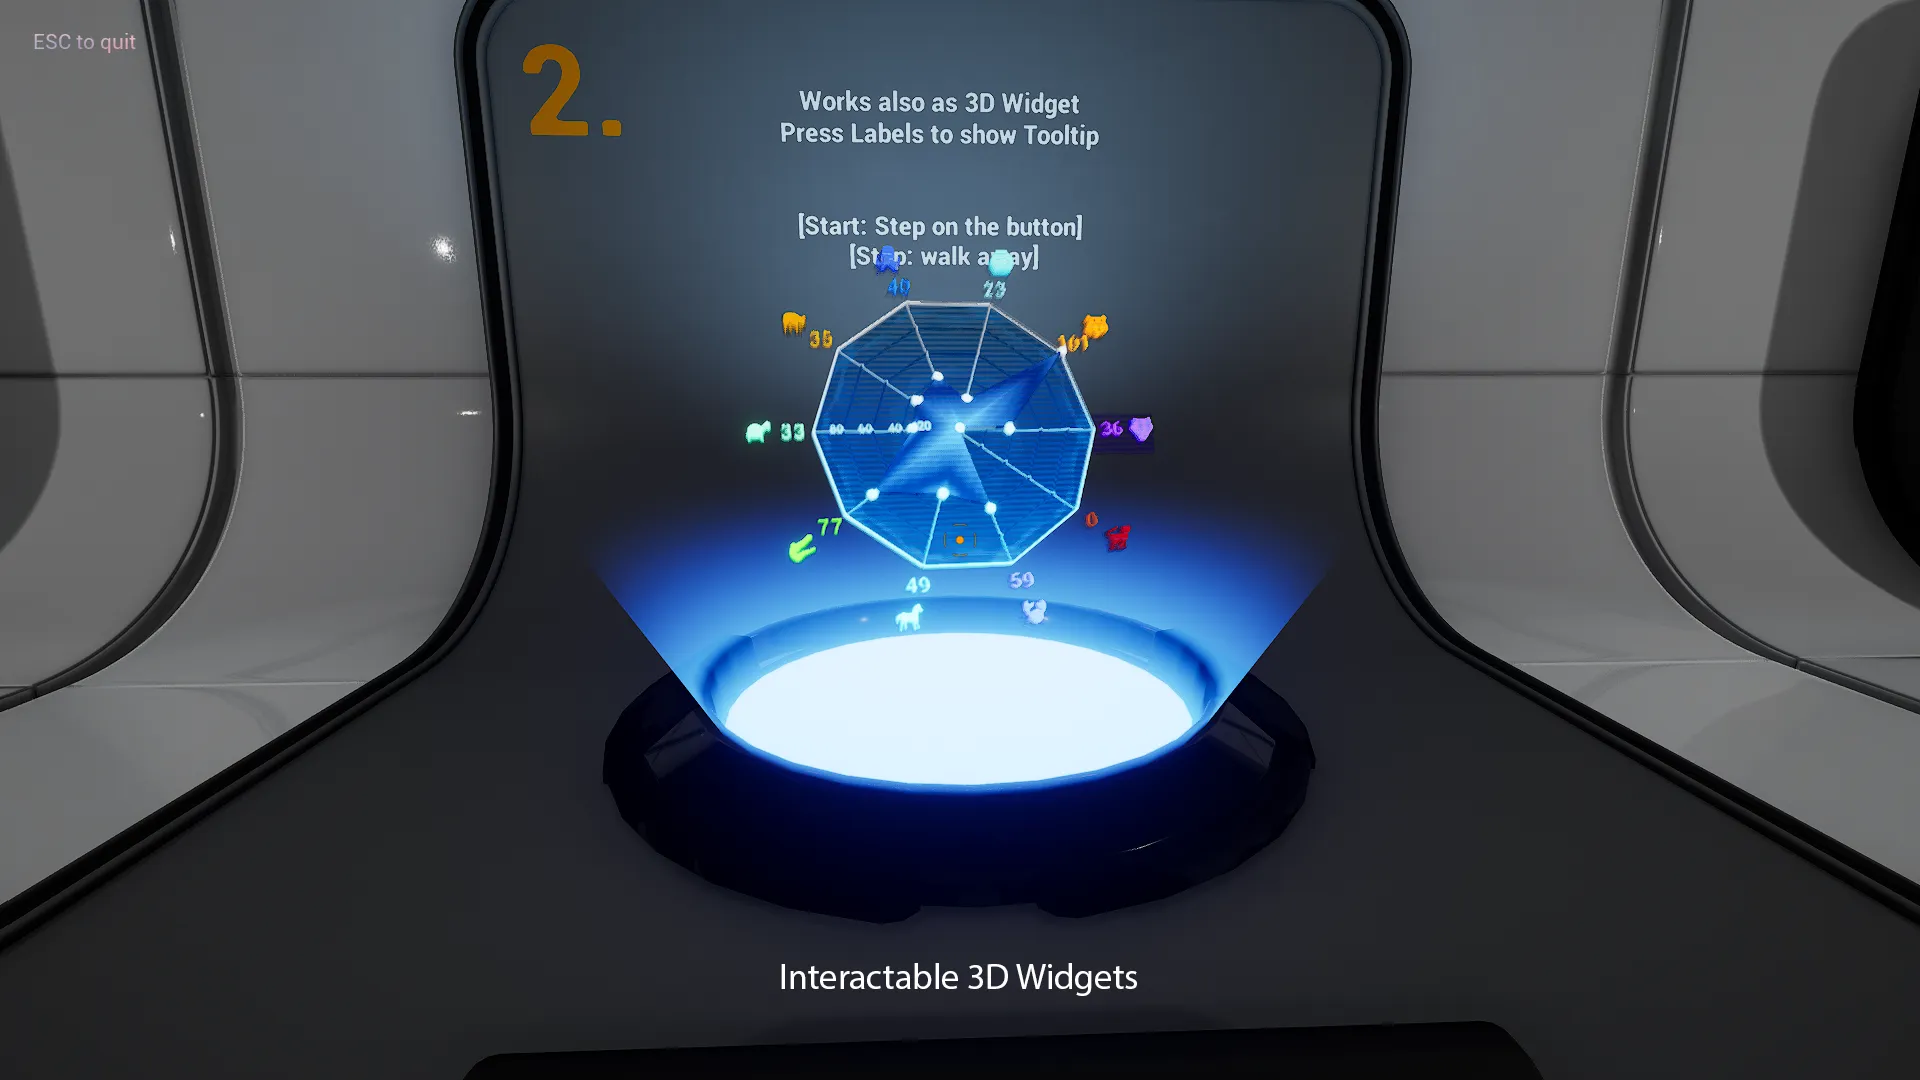
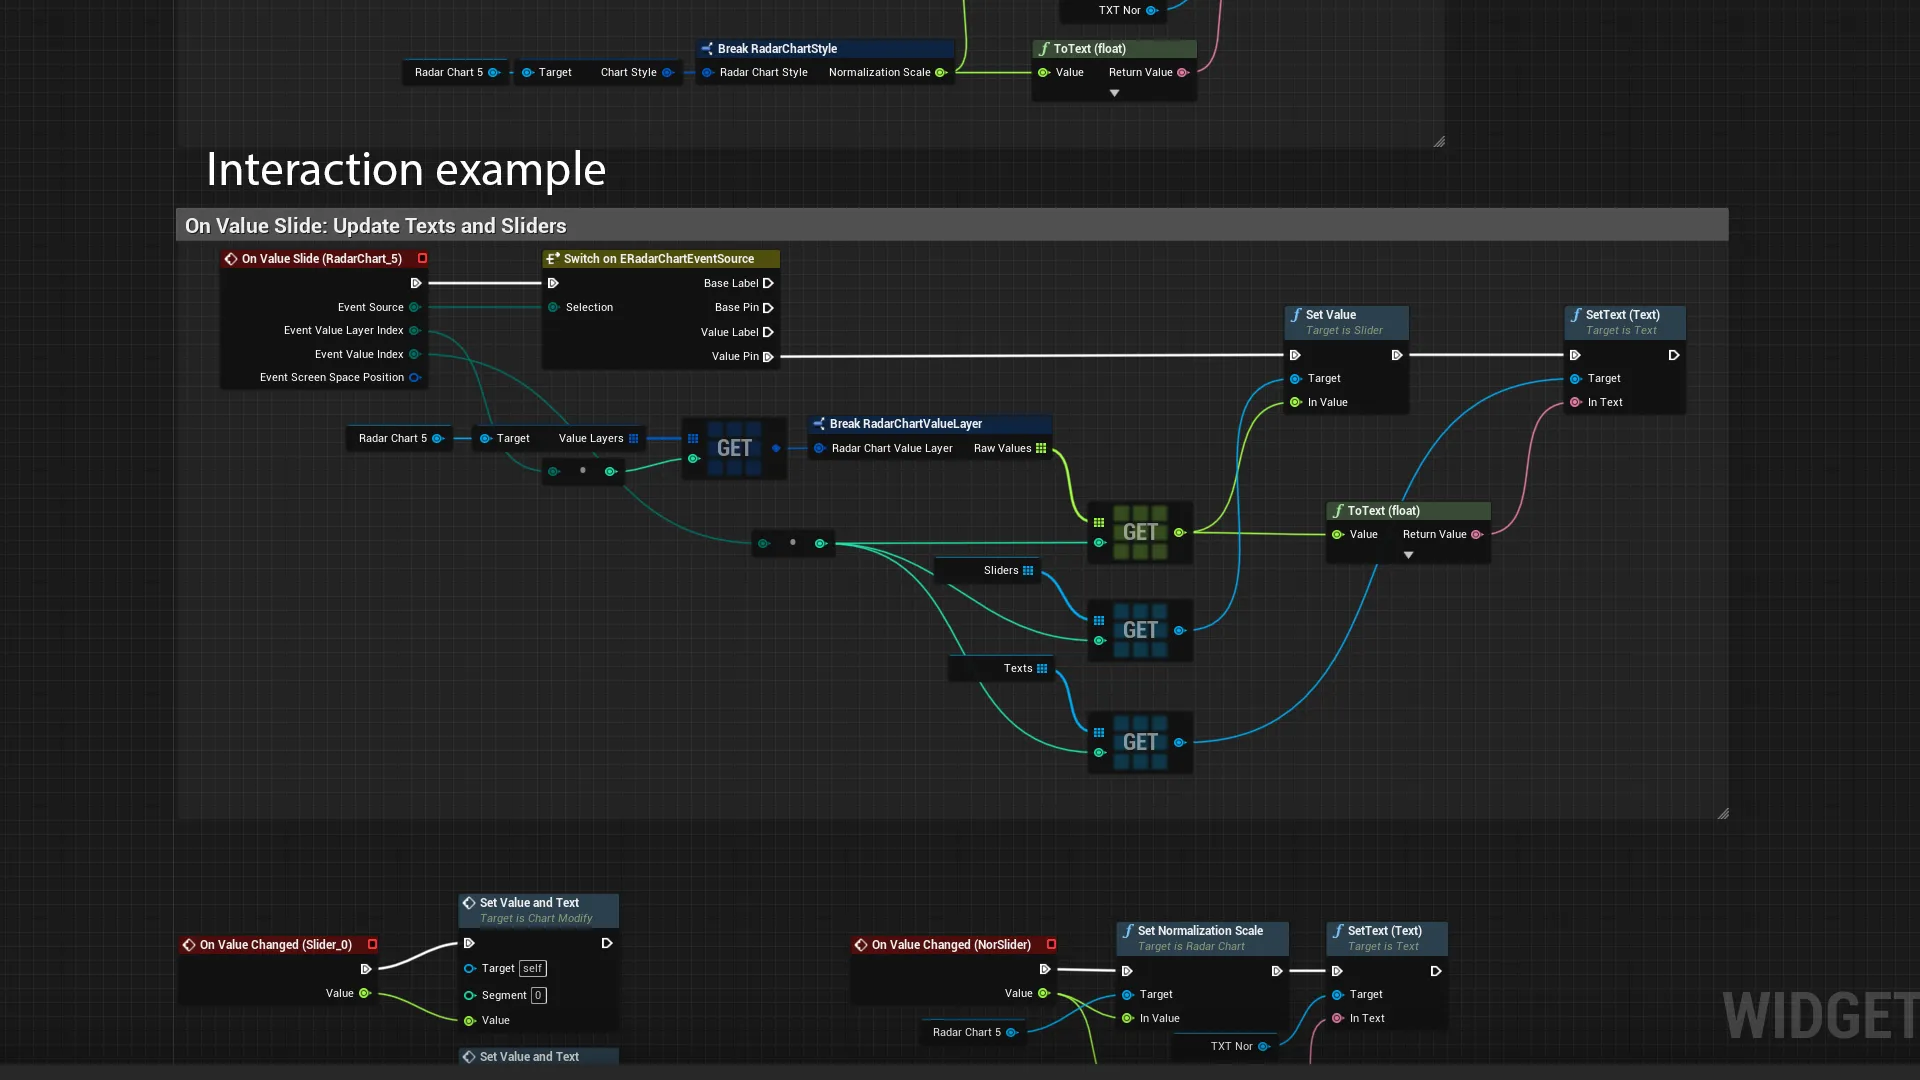
- With Mouse Input (OnHover & OnUnhover, OnPress & OnRelease, OnClick, OnValueSlide)
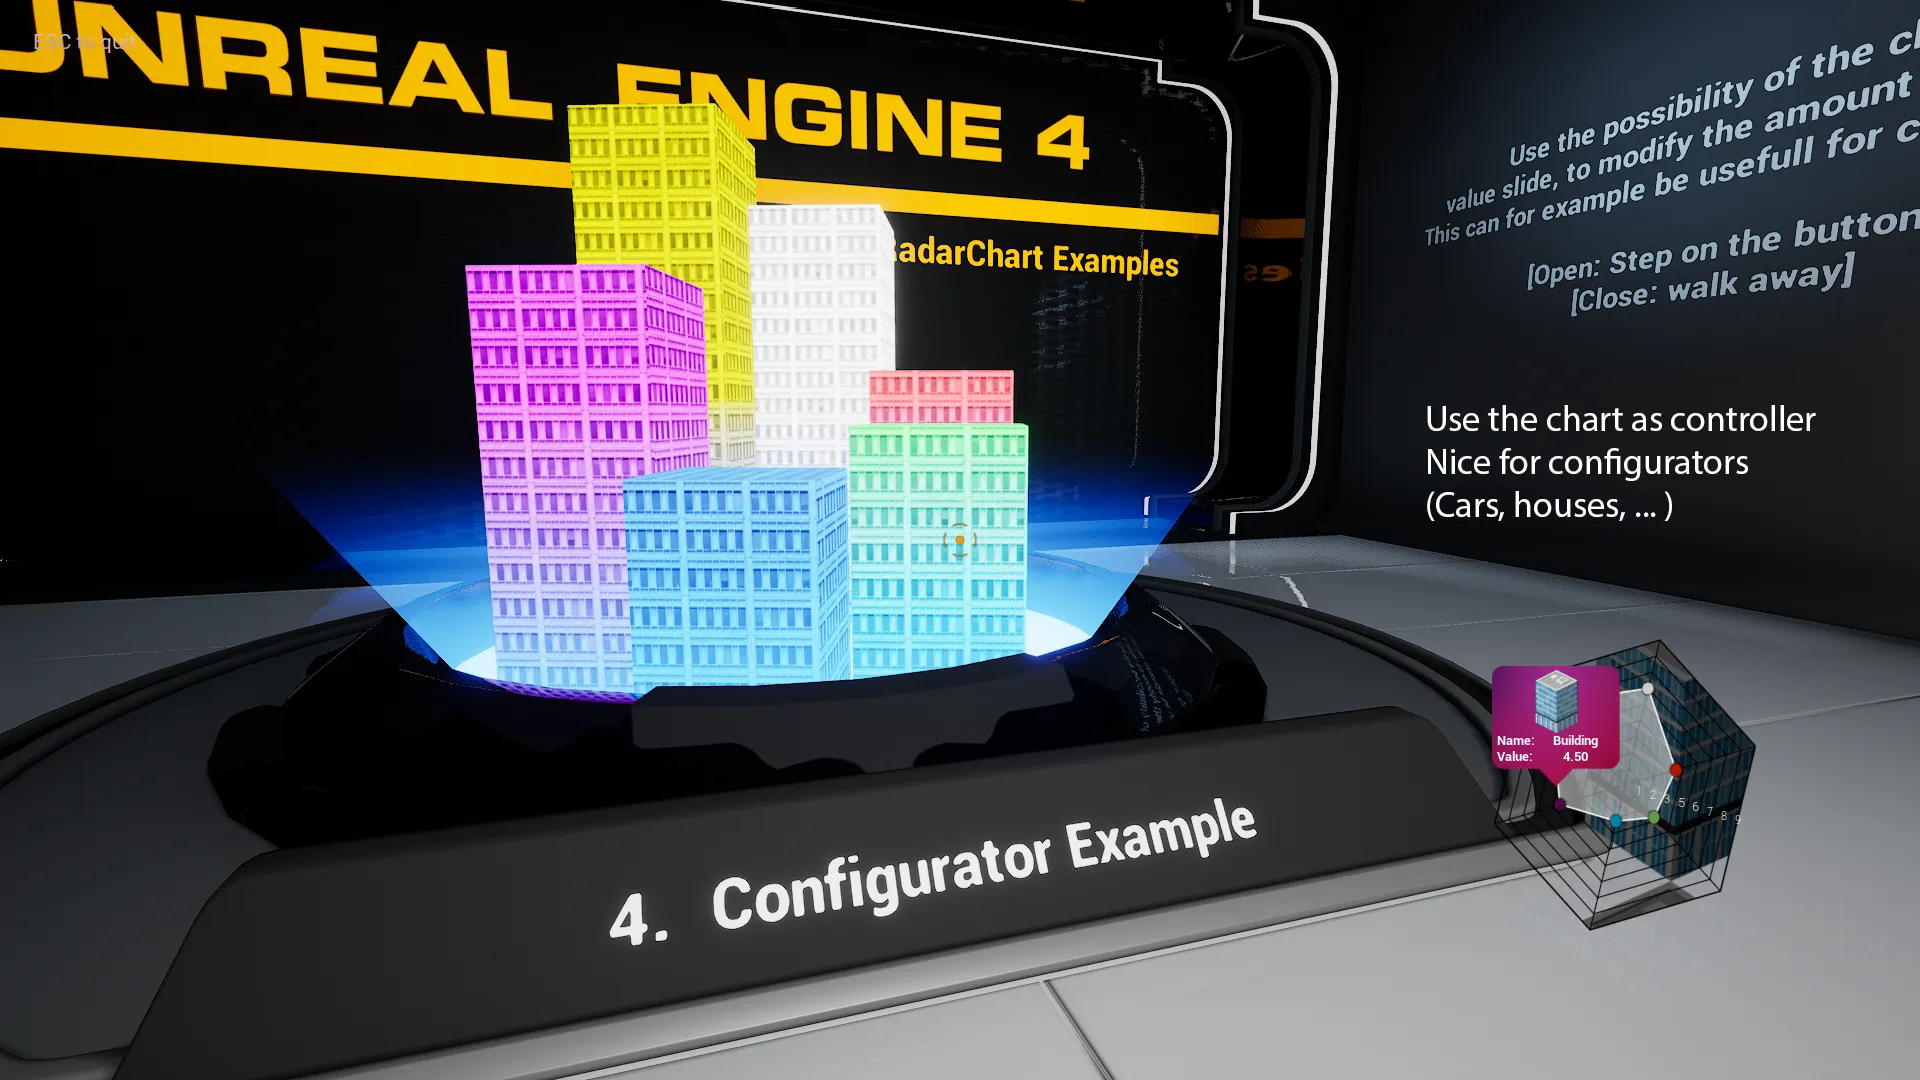
- Change values by dragging the pins (Value slide) – usefull for configurators
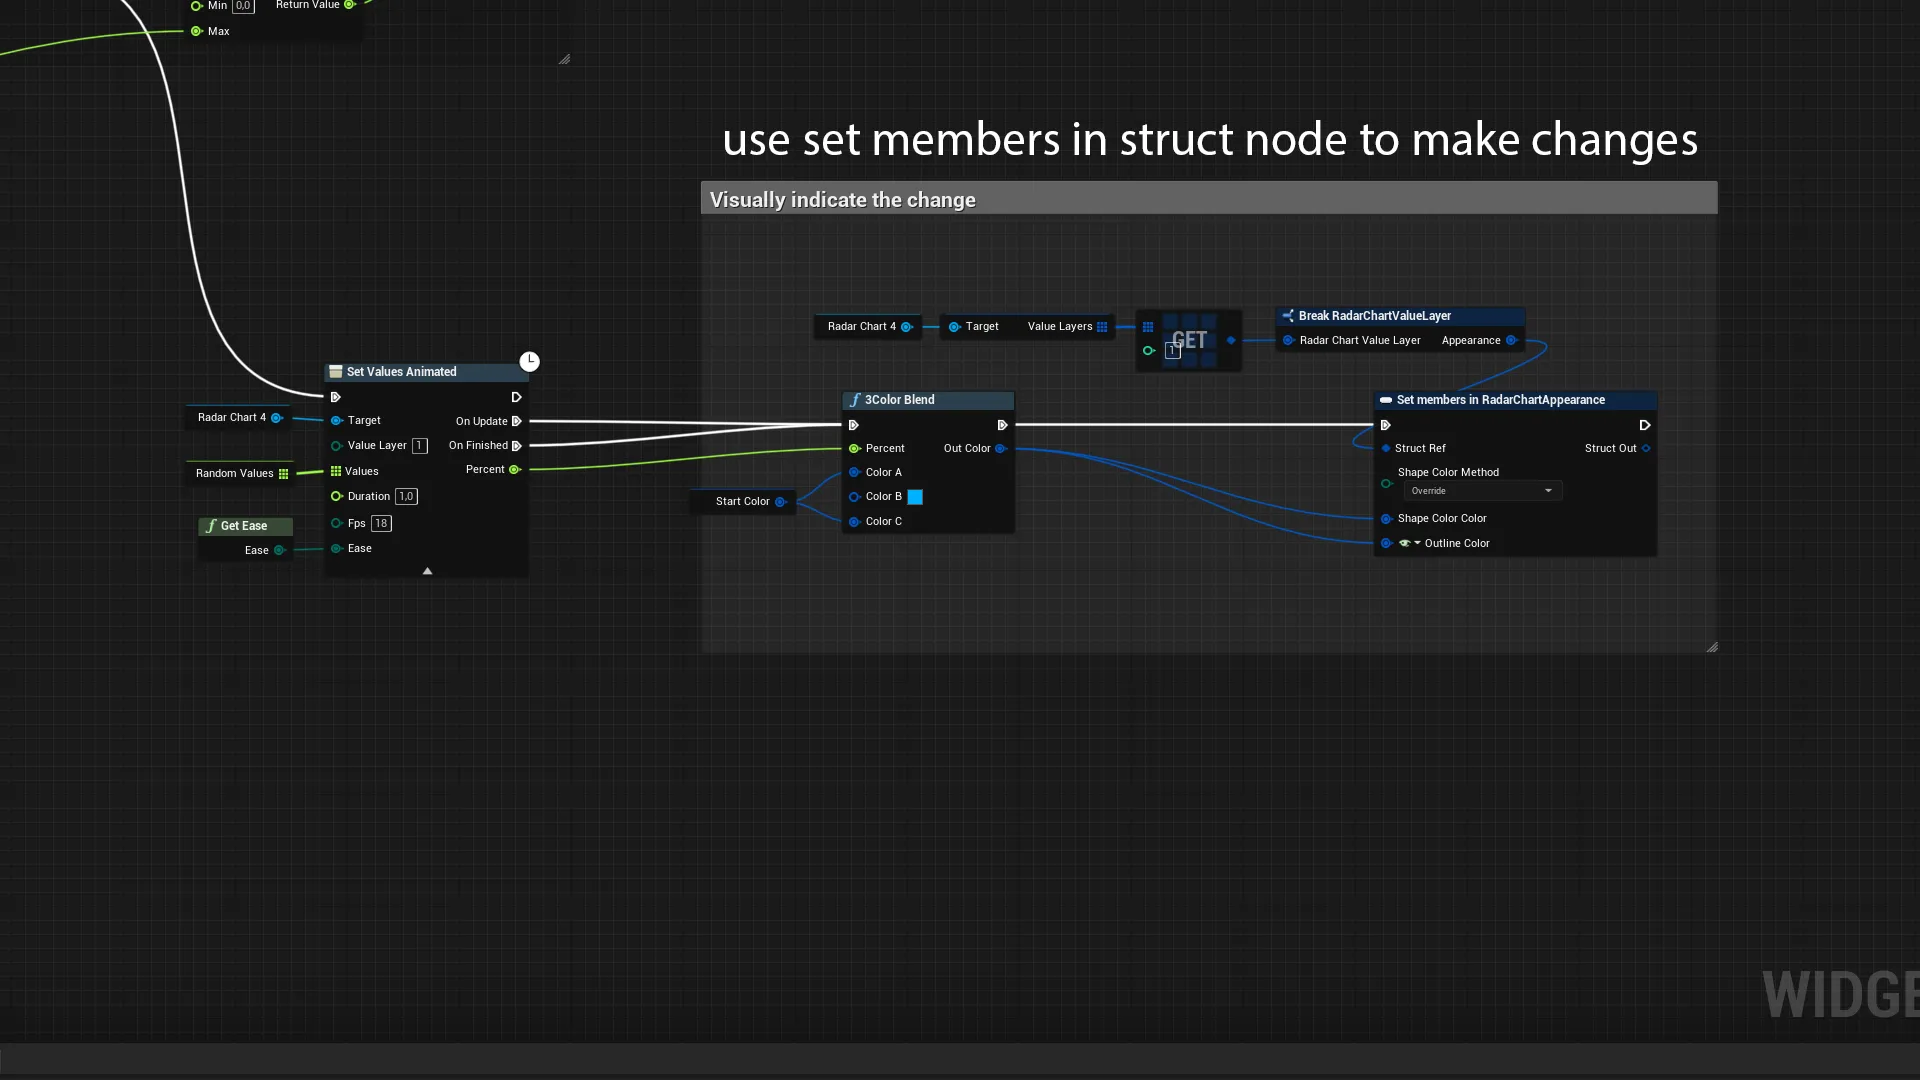
- Animated set values and normalization scale with multiple ease types
- Highly customizeable to fit every type of project
- Completely written in C++ for best performance
- Usable with UMG/Blueprints/C++ and in pure Slate (Style based)
- Easy to use
- Use multiple value layers to compare multiple datas or before and afters values, etc.
- Display Icons, Label Names, Values (with two different display variants: normal at the label or snapped to shape corner) and Pins (additional button at every shape corner)
- Use color coding to make the graph easier to read for the user
- The base and every value layer has it’s own appearance & interaction settings
Click here to view the full details of the resource.:URL
Click the button below to download.
Download:
