Streamlined Data Visualization with SimpleCharts
SimpleCharts offers a user-friendly approach to data visualization within your development environment. This plugin is designed to help developers create clear and informative charts without complex setups. By focusing on ease of use, the developer has ensured that the tool remains accessible for various project types. Consequently, you can integrate visual data representation into your application with minimal effort.
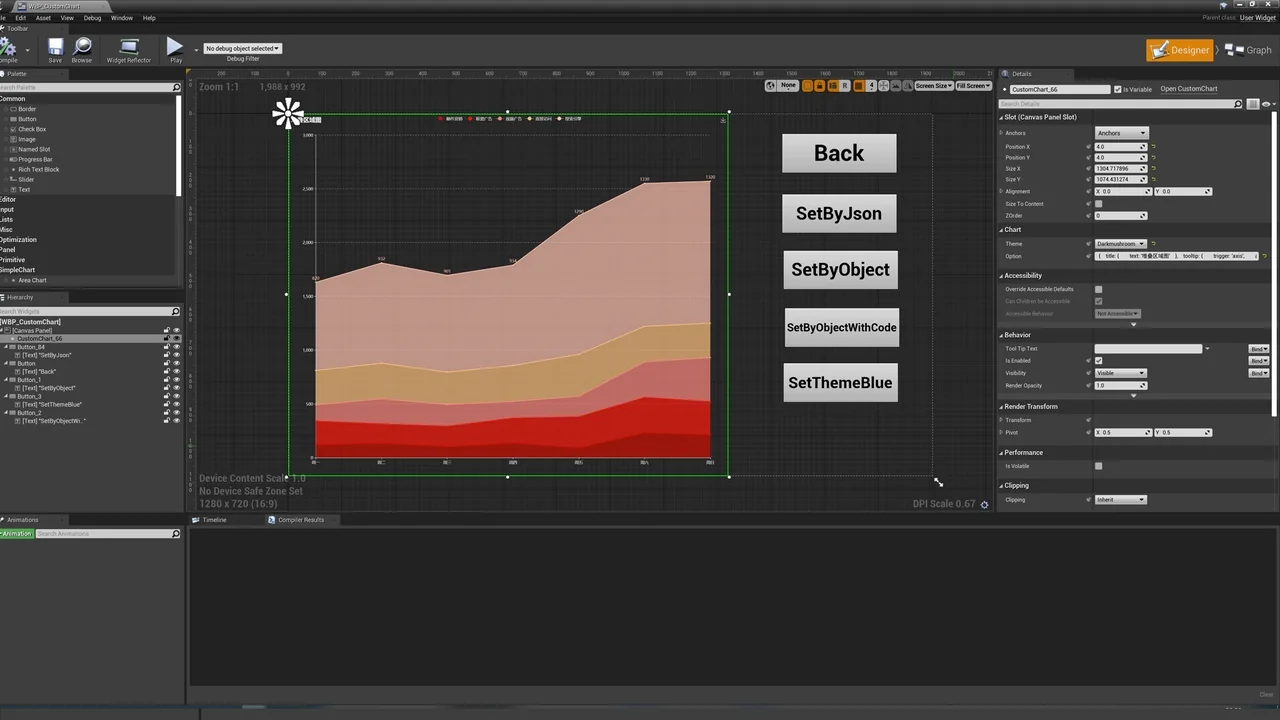
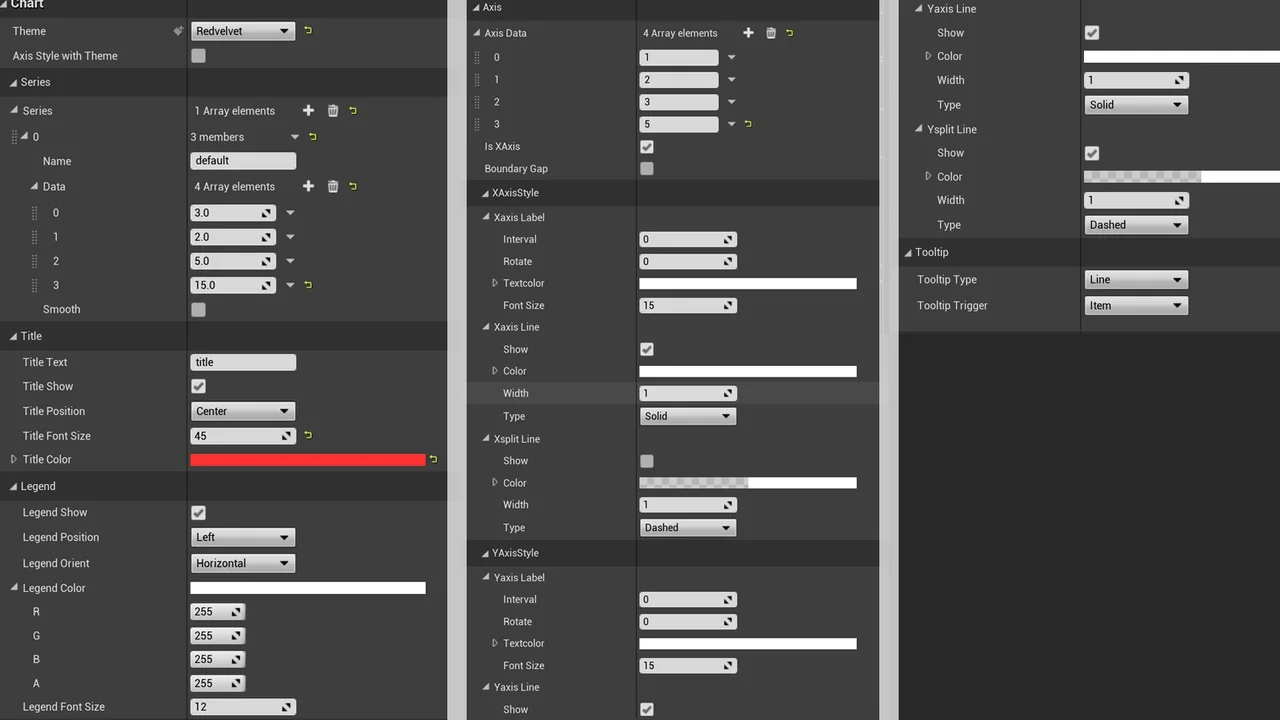
Flexible Integration via UMG and Blueprints
One of the primary benefits of using SimpleCharts is its flexible workflow. You can choose to use the plugin completely through UMG, which allows for a visual and intuitive design process. This integration ensures that your charts fit seamlessly within your existing user interface. Furthermore, the plugin supports Blueprints for those who require more dynamic functionality.
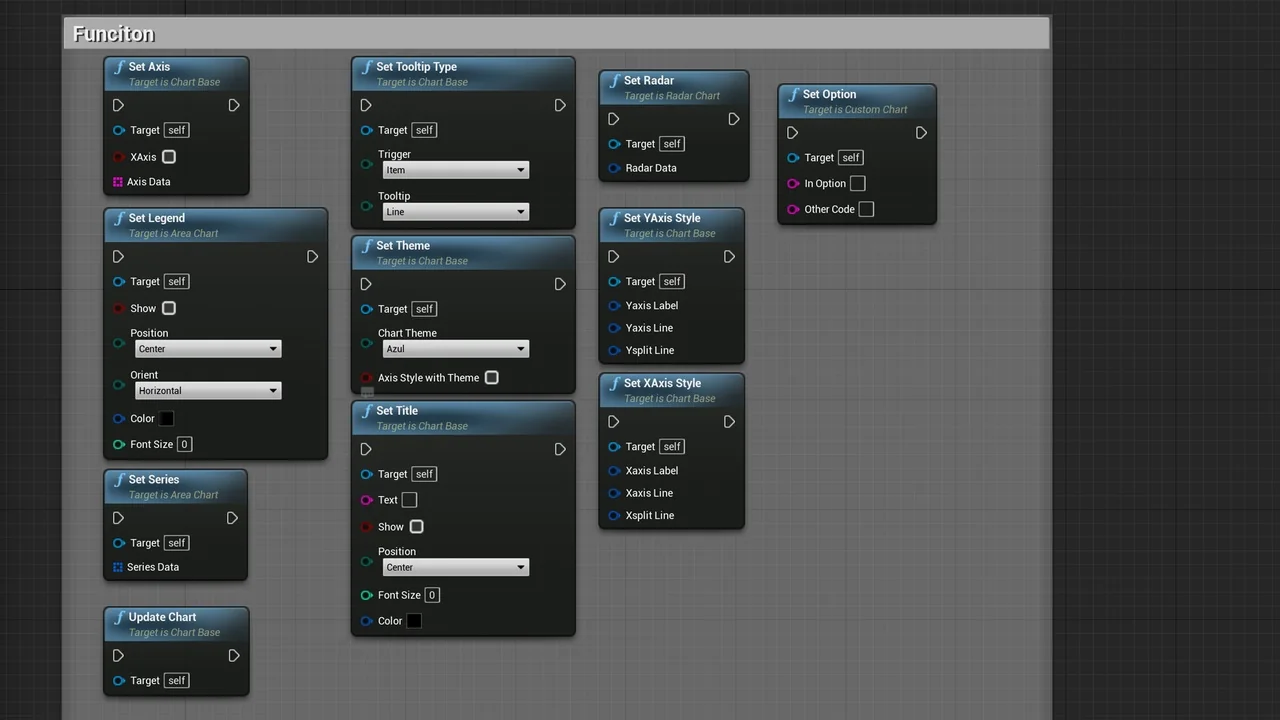
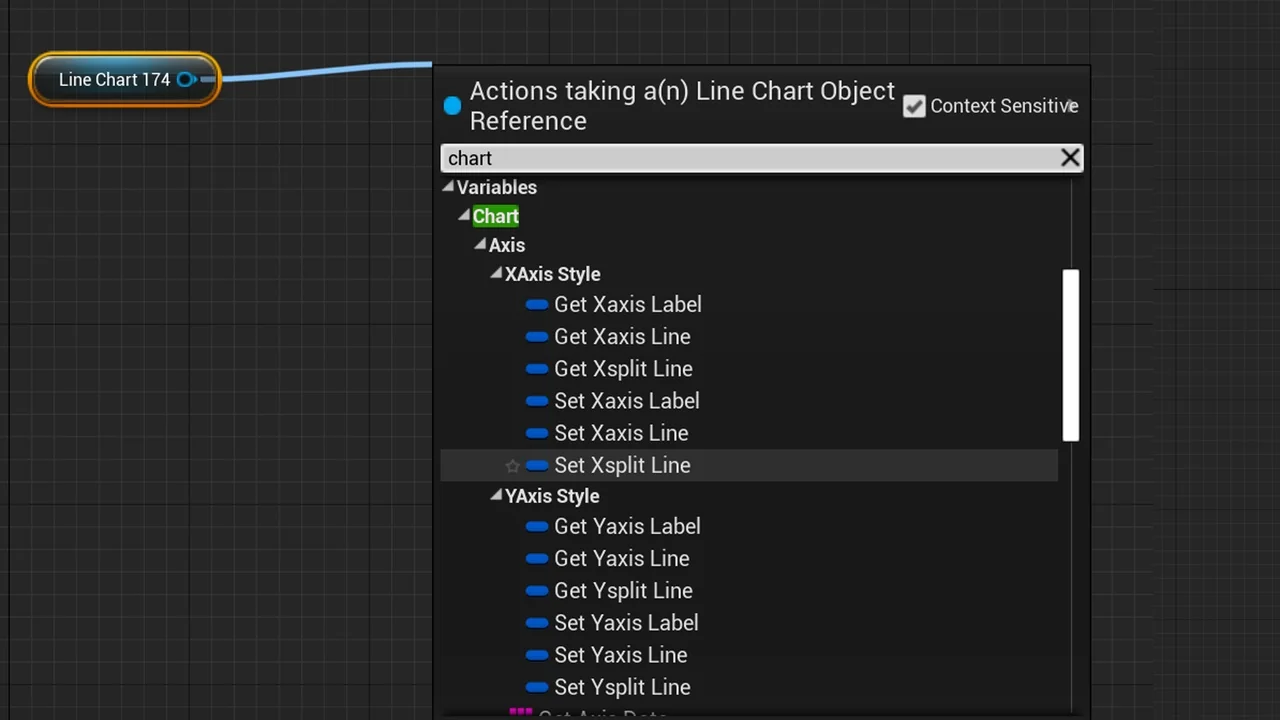
Using Blueprints, you can update your charts at runtime. This feature is essential for projects that display real-time data or require frequent updates based on user interaction. Therefore, the plugin provides a robust solution for both static and interactive data displays. The creator has optimized these systems to work efficiently within the standard engine framework.
Advanced Web Browser Support and IME Integration
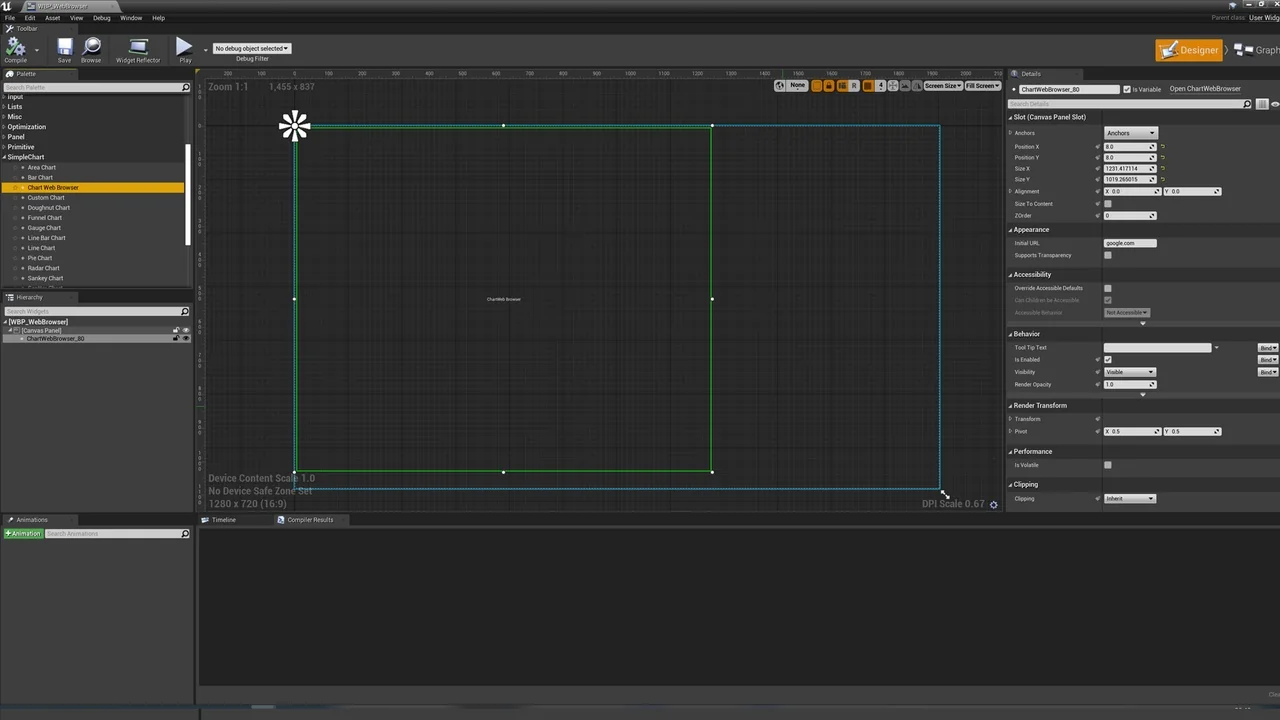
The SimpleCharts plugin has evolved to meet modern development needs. Initially, it faced limitations with web browser integration. However, it now supports nearly 4.27 compatibility with WebBrowser. This update allows for a more integrated experience when dealing with web-based content alongside your native UI elements.
For developers who require specific web functionality, the plugin provides a dedicated control called ChartWebBrowser. This control is designed to be exactly the same as the official function. Additionally, it includes support for the Input Method Editor (IME). This means you can use IME input within the browser control, which is a significant advantage for global applications requiring complex character entry.
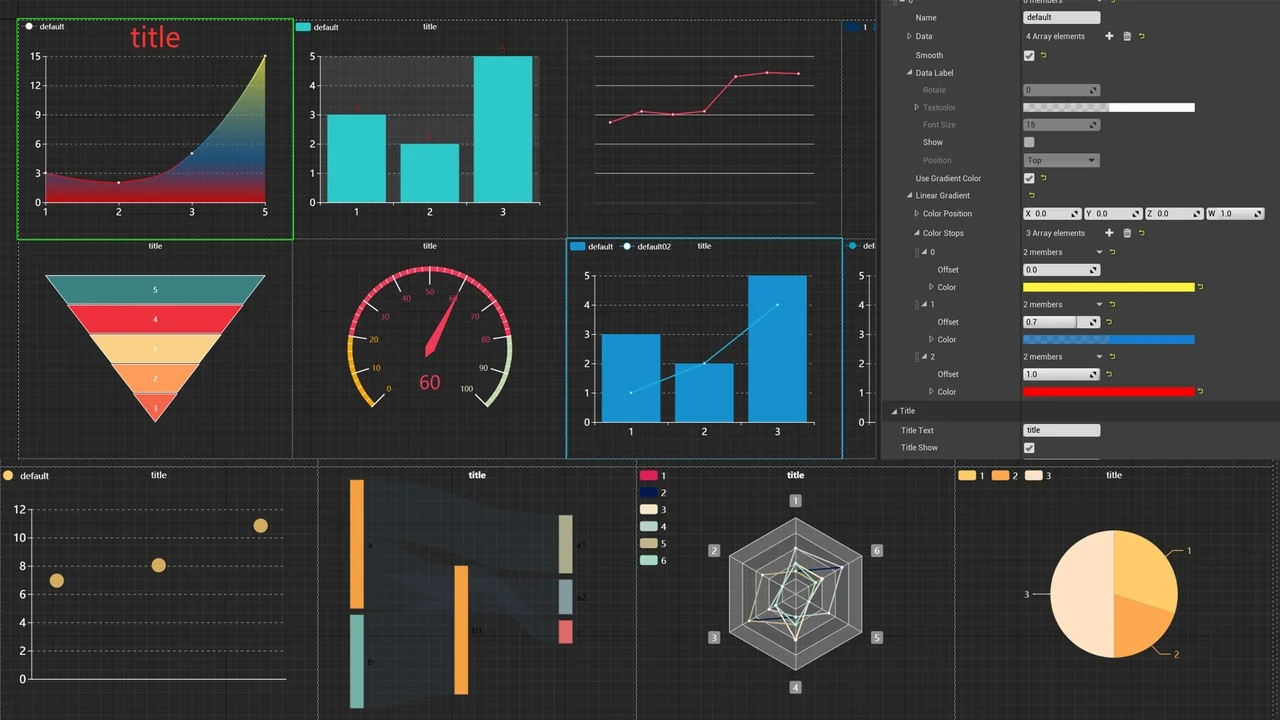
Powered by Echarts for Quality Output
The charts generated by this plugin are based on the Echarts library. This foundation ensures that the visual output is both professional and reliable. By leveraging this technology, SimpleCharts can produce high-quality visualizations that are easy to read and interpret. The developer chose this base to provide a solid engine for all charting requirements.
Cross-Platform Performance and Testing
Compatibility is a vital factor for any development resource. SimpleCharts has been tested on several key platforms to ensure stability. At present, the creator has verified its performance on the win64 platform and the Android platform. These tests confirm that the plugin functions correctly on both desktop and mobile environments.
While these are the currently tested platforms, the developer believes that other platforms should also be supported. This makes SimpleCharts a versatile choice for cross-platform development. Whether you are building for Windows or mobile devices, the plugin offers a consistent experience across different hardware.
Conclusion
In conclusion, SimpleCharts provides an efficient and powerful way to handle data visualization. With its dual support for UMG and Blueprints, it caters to different development styles. The inclusion of specialized browser controls and IME support further enhances its utility. If you need a reliable charting solution for win64 or Android, this plugin offers the necessary tools to succeed.
Screenshots & Gallery